

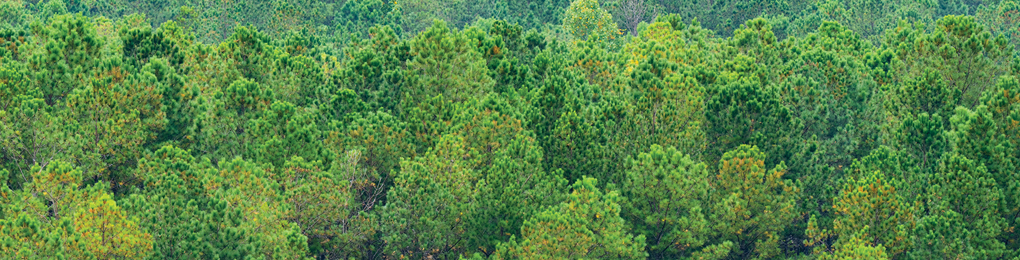
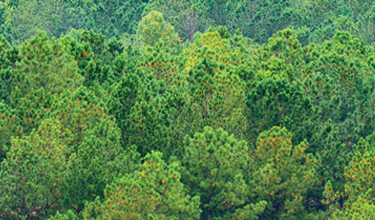

Idaho Region Scenario Analysis
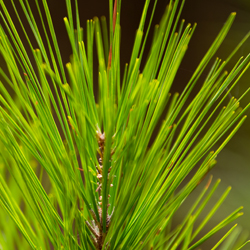
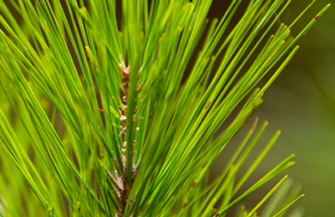
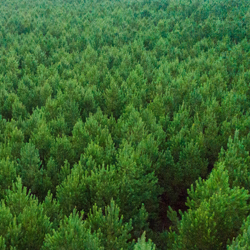
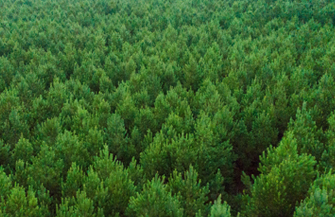
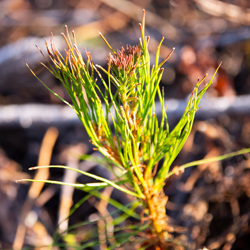
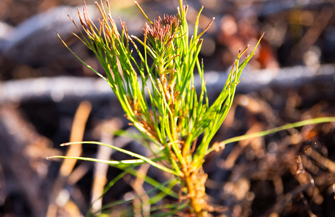
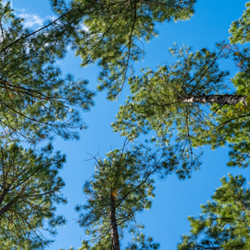
PotlatchDeltic is the largest private landowner in Idaho with approximately 626,000 acres of timberland in northern Idaho.1 Our average site index on the PotlatchDeltic Idaho timberlands is considerably higher than the average Inland Northwest due to better soils with a volcanic ash base, higher precipitation, and an ideal elevation.2 The higher site index results in more rapid growth and shorter rotations resulting in higher annual harvests, lower stand establishment costs due to better seedling survival on good sites, higher stocking at final harvest which reduces logging costs, and more valuable species mix. Species we grow include Douglas-fir, western larch, western red cedar, grand fir, ponderosa pine, Engelmann spruce, and lodgepole pine. Third-party nurseries grow Idaho seedlings, with 70% of the seeds being sourced from our Cherrylane Seed Orchard. The seed orchard is used to increase seed production of the highest performing trees for planting on our Idaho timberlands through breeding and selection. We select the species that is best suited to the site-specific location and elevation for replanting.
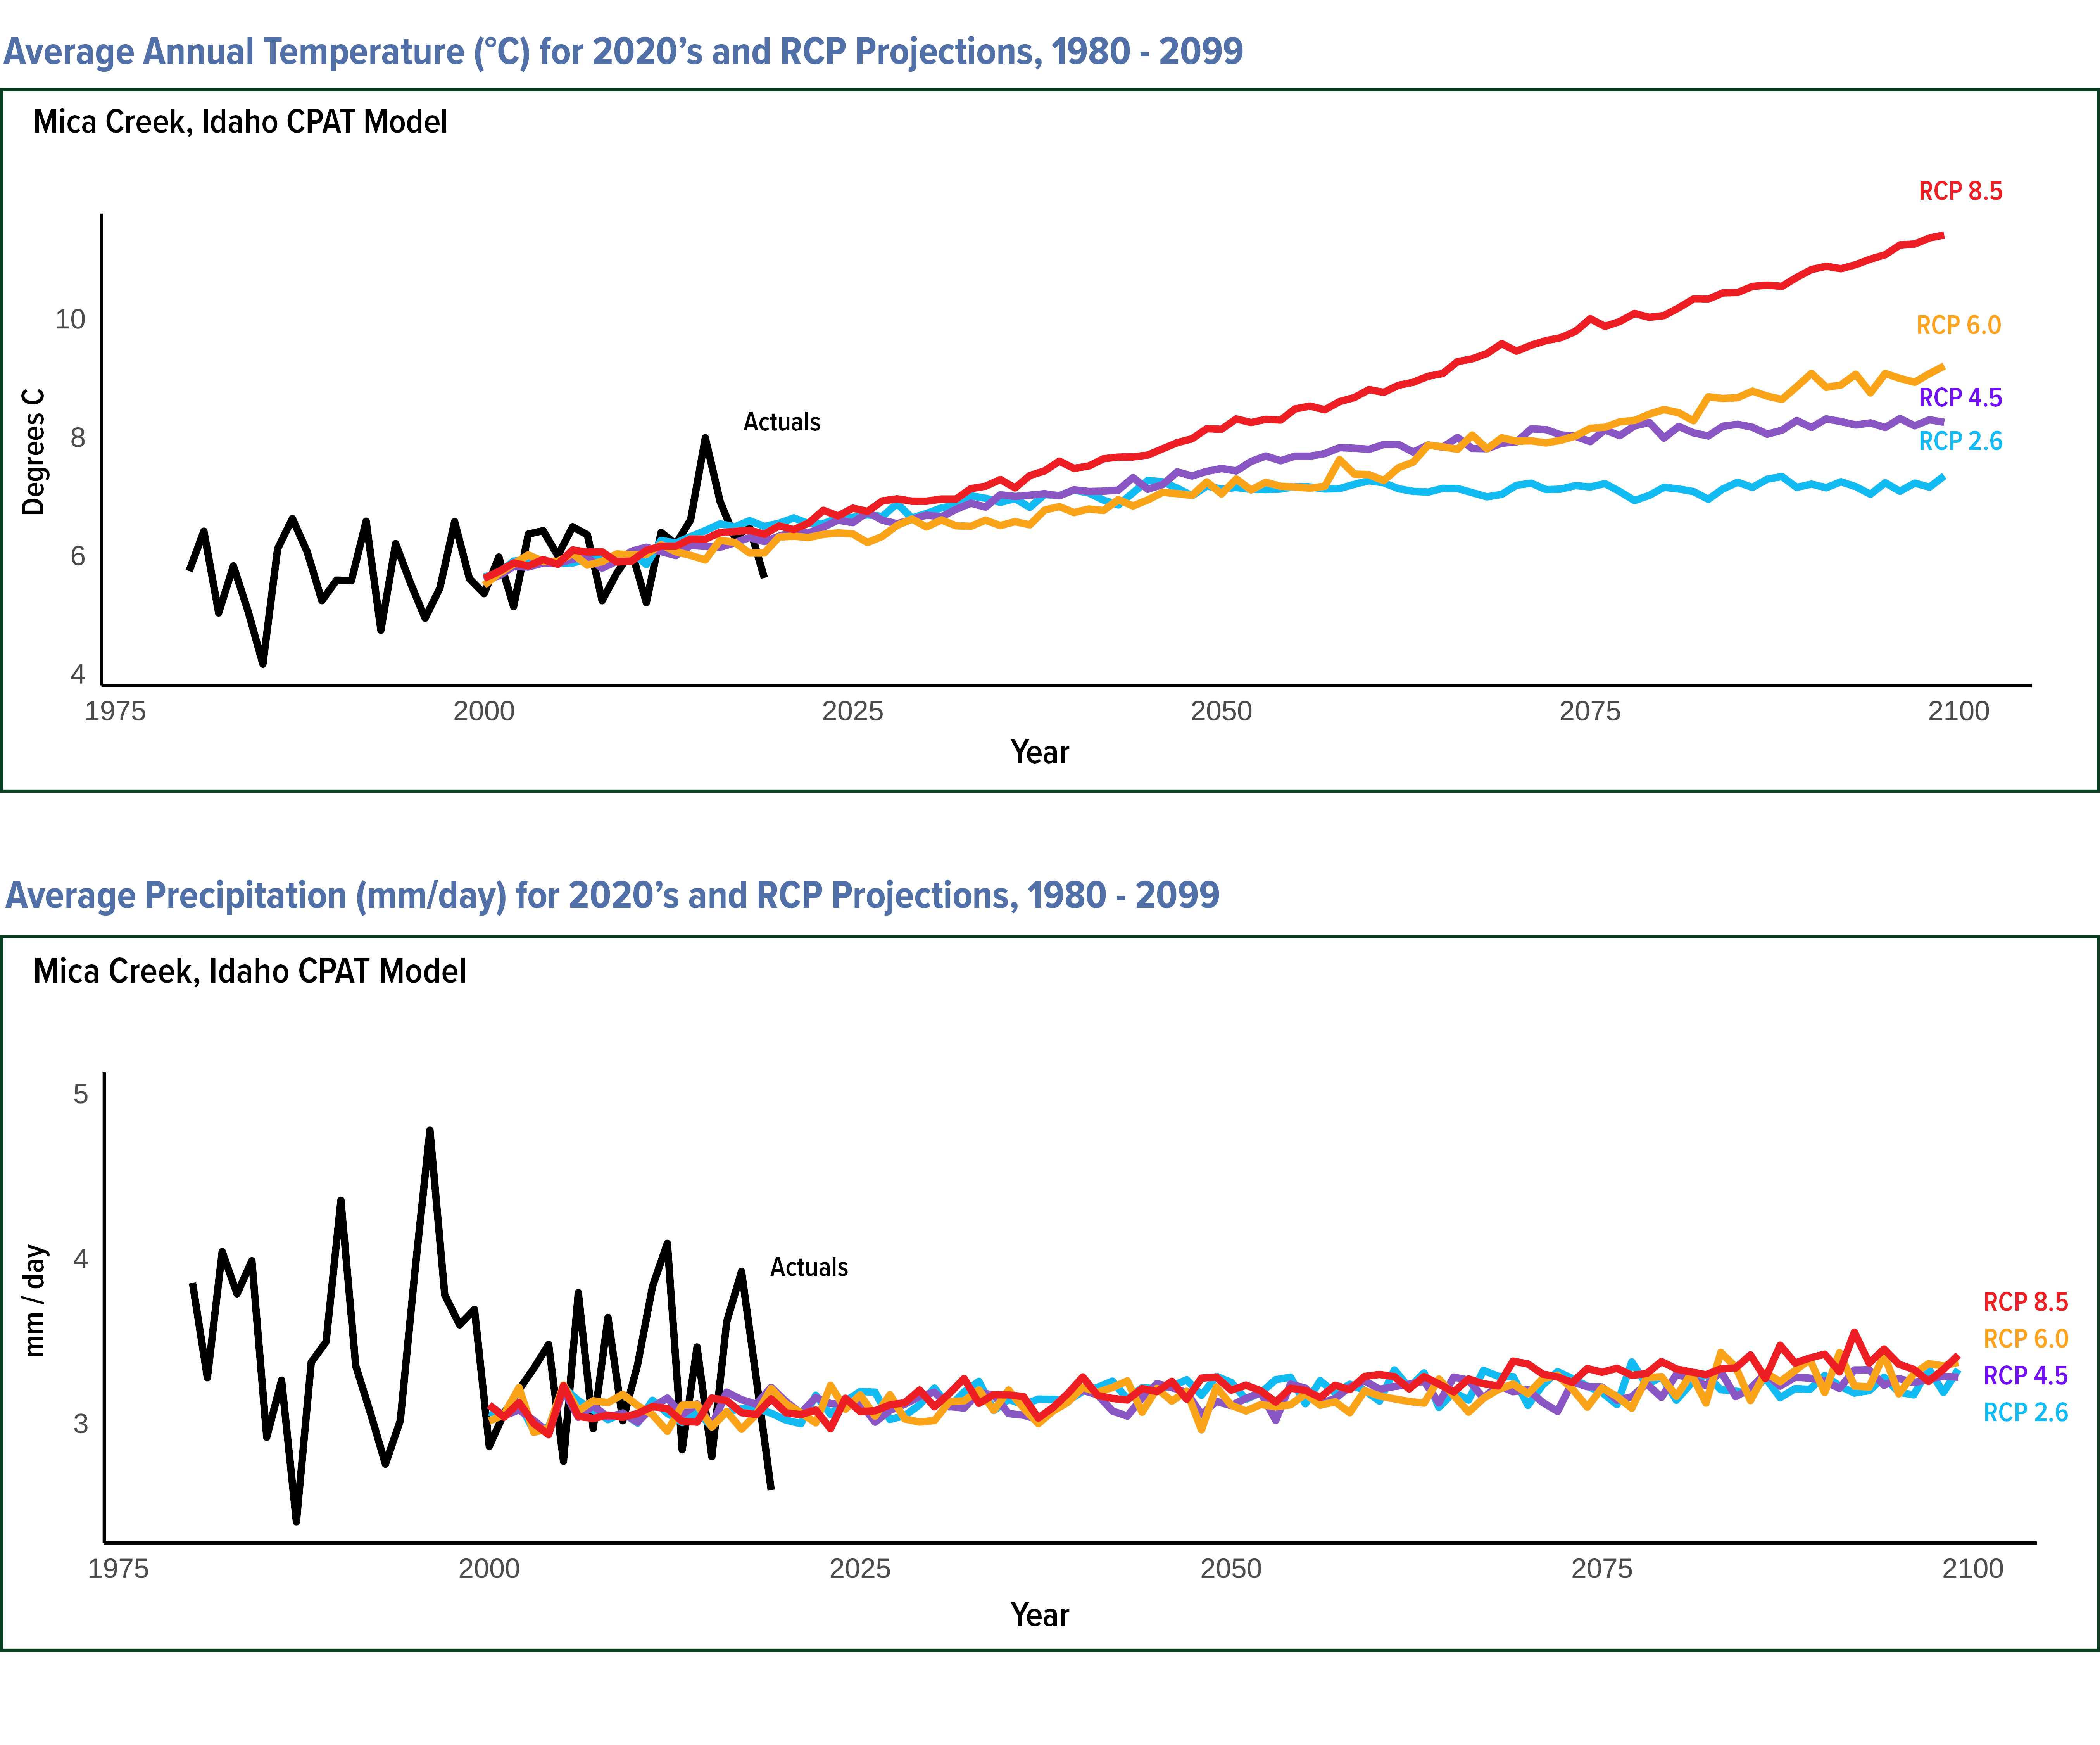
Temperature projections for our northern Idaho region were modeled using CPAT under the four RCPs. Using RCP 2.6, downscaled temperature projections for the region reveal a temperature increase of about 0.5°C from the 2020’s to the 2040’s with no additional increase through the rest of the century. RCP 4.5 shows a temperature increase of approximately 0.7°C from the 2020’s to the 2040’s with an additional increase of roughly 1.0°C expected through the rest of the century. Similarly, RCP 6.0 shows a temperature increase of about 0.6°C from the 2020’s to the 2040’s with an additional increase of approximately 2.0°C through the rest of the century. RCP 8.5 shows a steady increase of roughly 4.4°C between the 2020’s and the end of the century.
Precipitation projections for northern Idaho using CPAT do not vary meaningfully by RCP and all four pathways project a very gradual increase of 5-15% from 2020 to 2100. Increases tend to be greater at higher elevations on the northern portion of our ownership and lower on the southern, low-elevation lands.
Douglas-fir Climate Boundary and Productivity Assessment
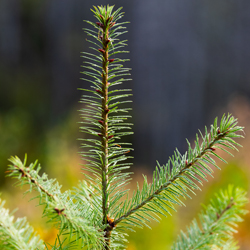
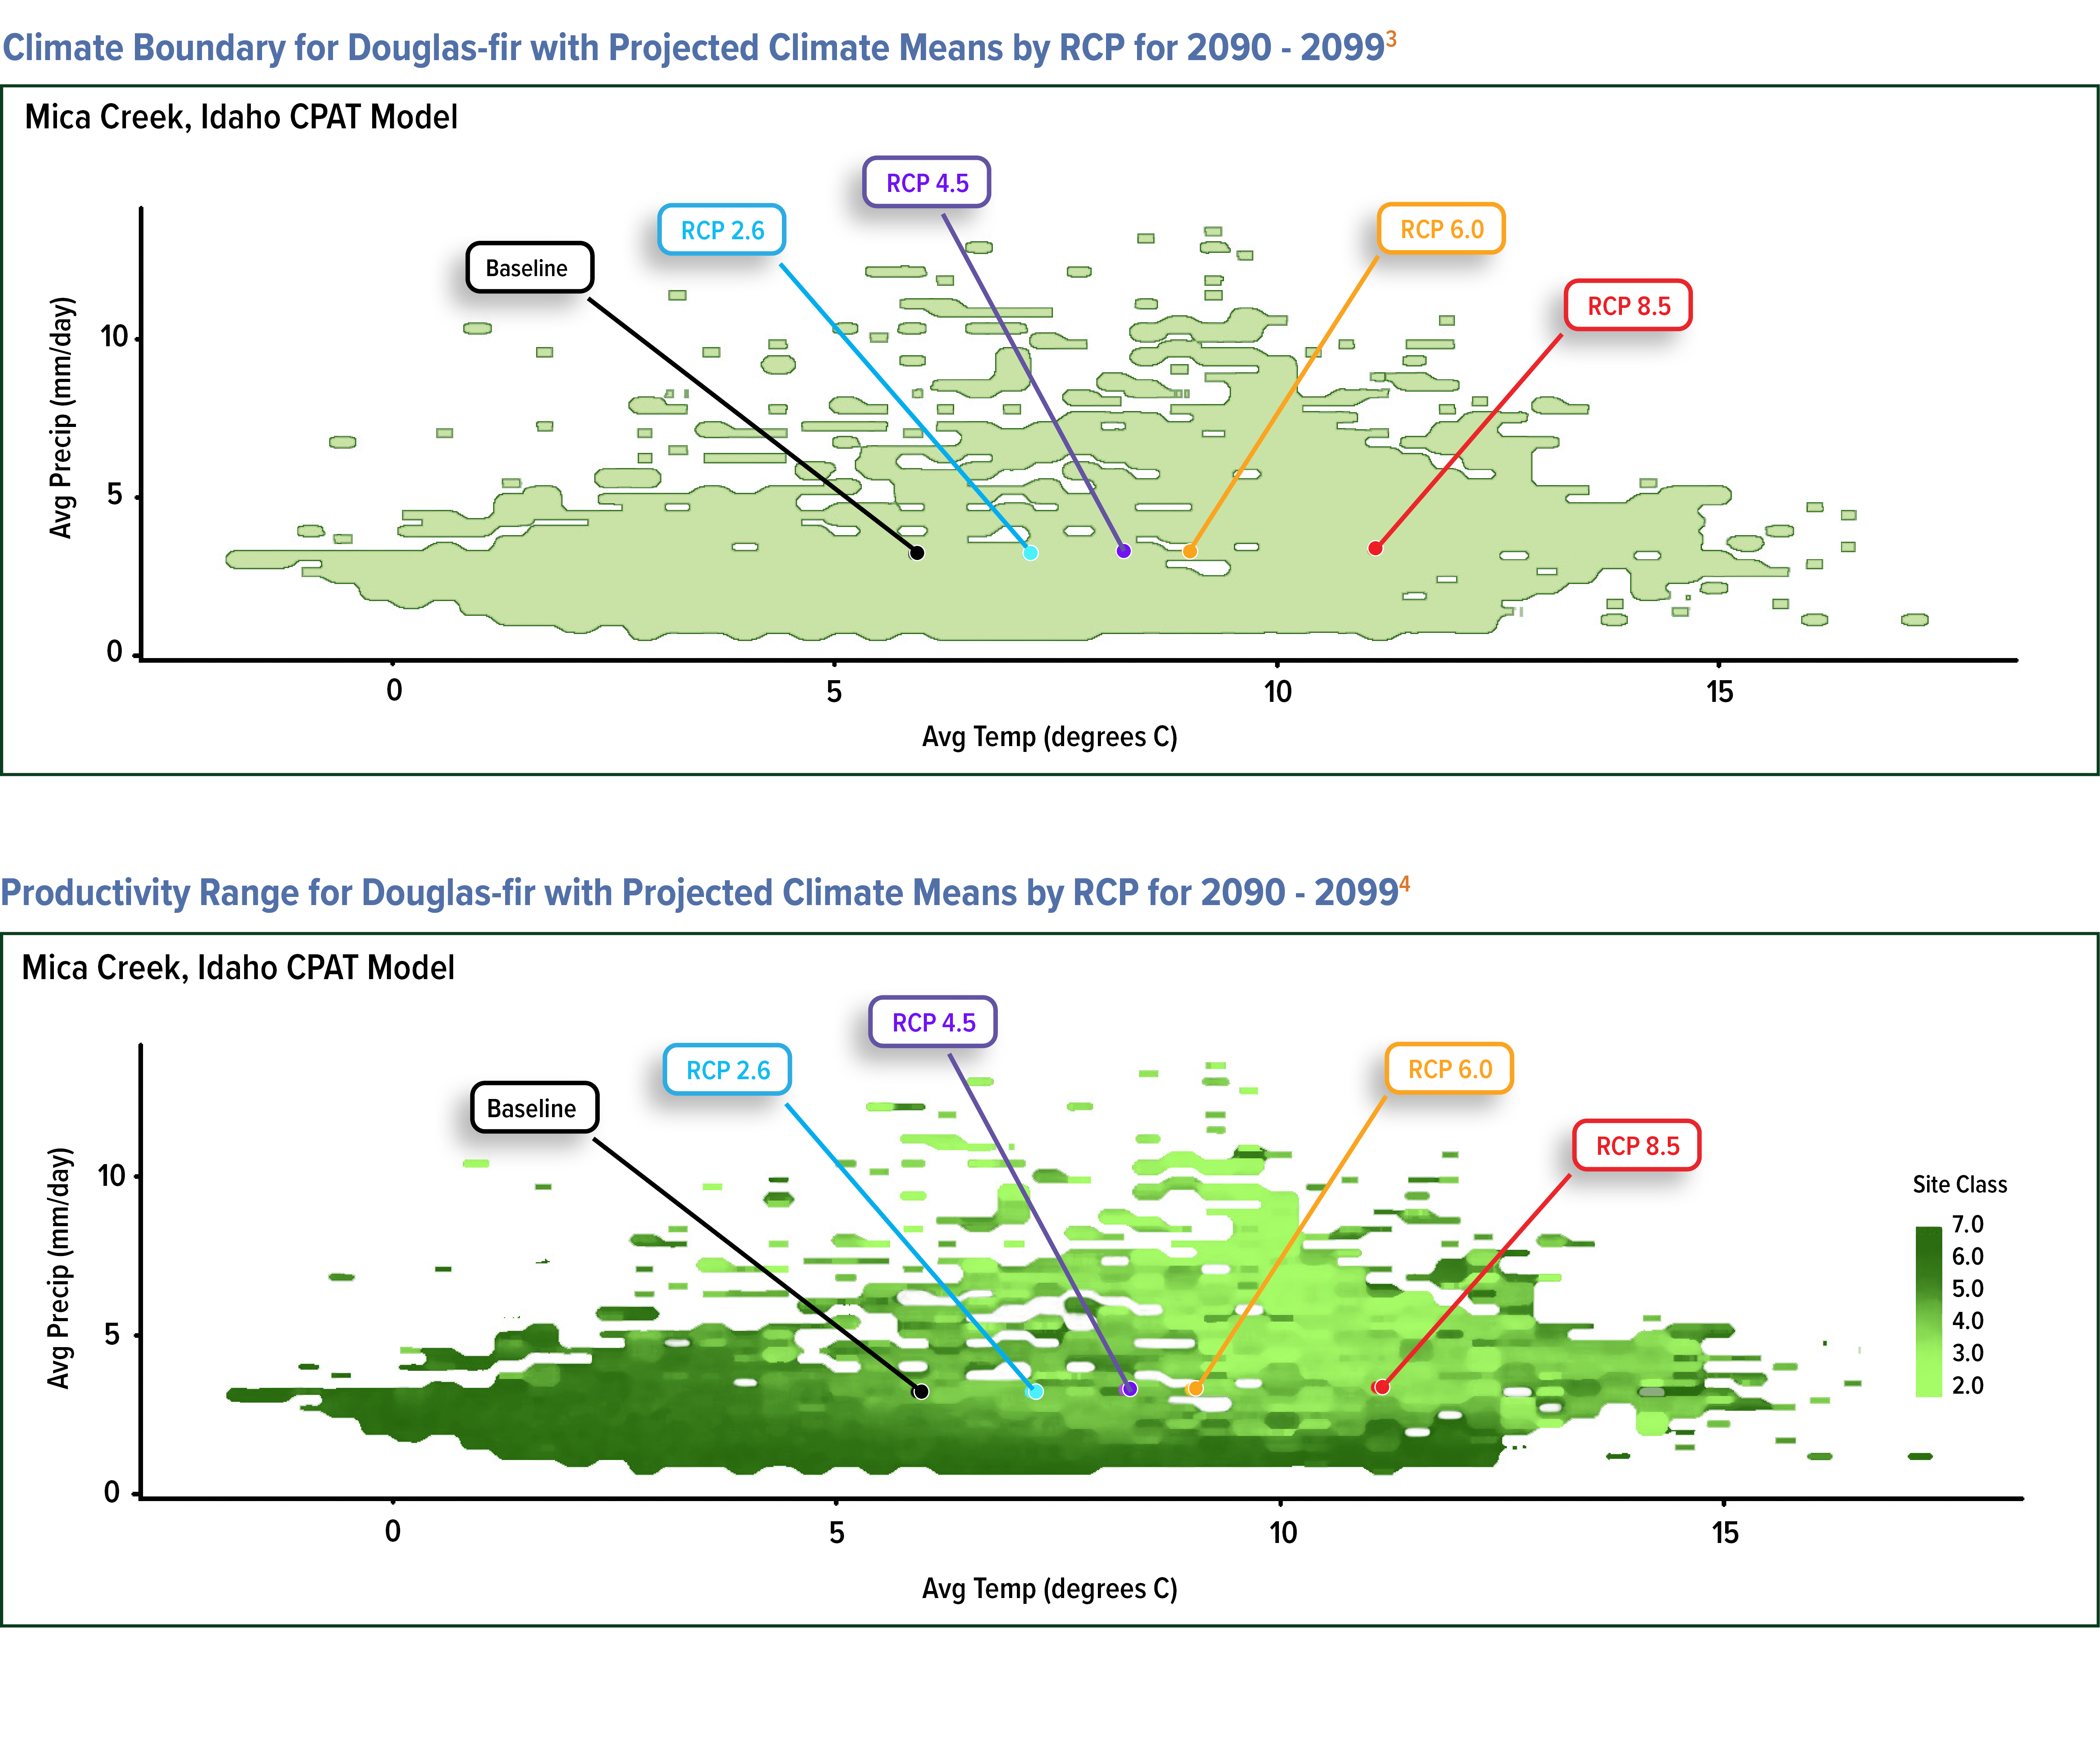
Douglas-fir accounts for approximately 60% of the seedlings planted on our Idaho timberlands. The species grows best in full sun or partial shade and prefers acidic or neutral soil that is well drained. It is moderately drought resistant and less prone to insects and disease than other coniferous species. Downscaled RCP 2.6, 4.5 and 6.0 projections for northern Idaho indicate annual climatic conditions are projected to be well suited for growth and productivity through the 2060 decade, which provides a full growing cycle, and through 2100.
The CPAT climate boundary analysis for Douglas-fir illustrates that the projected range of temperature and precipitation will be suitable for its growth under all RCP scenarios through 2100. In addition, the current range of Douglas-fir in the US extends into Colorado, Arizona and New Mexico suggesting that it can survive in conditions found at latitudes well south of Idaho.
The analysis for Douglas-fir productivity arising from a combination of temperature and precipitation under various RCP scenarios in 2090-2099 illustrates that conditions remain favorable for Douglas-fir and loss of productivity is not projected.
Western Red Cedar Climate Boundary and Productivity Assessment
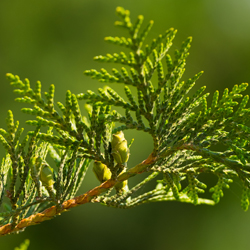
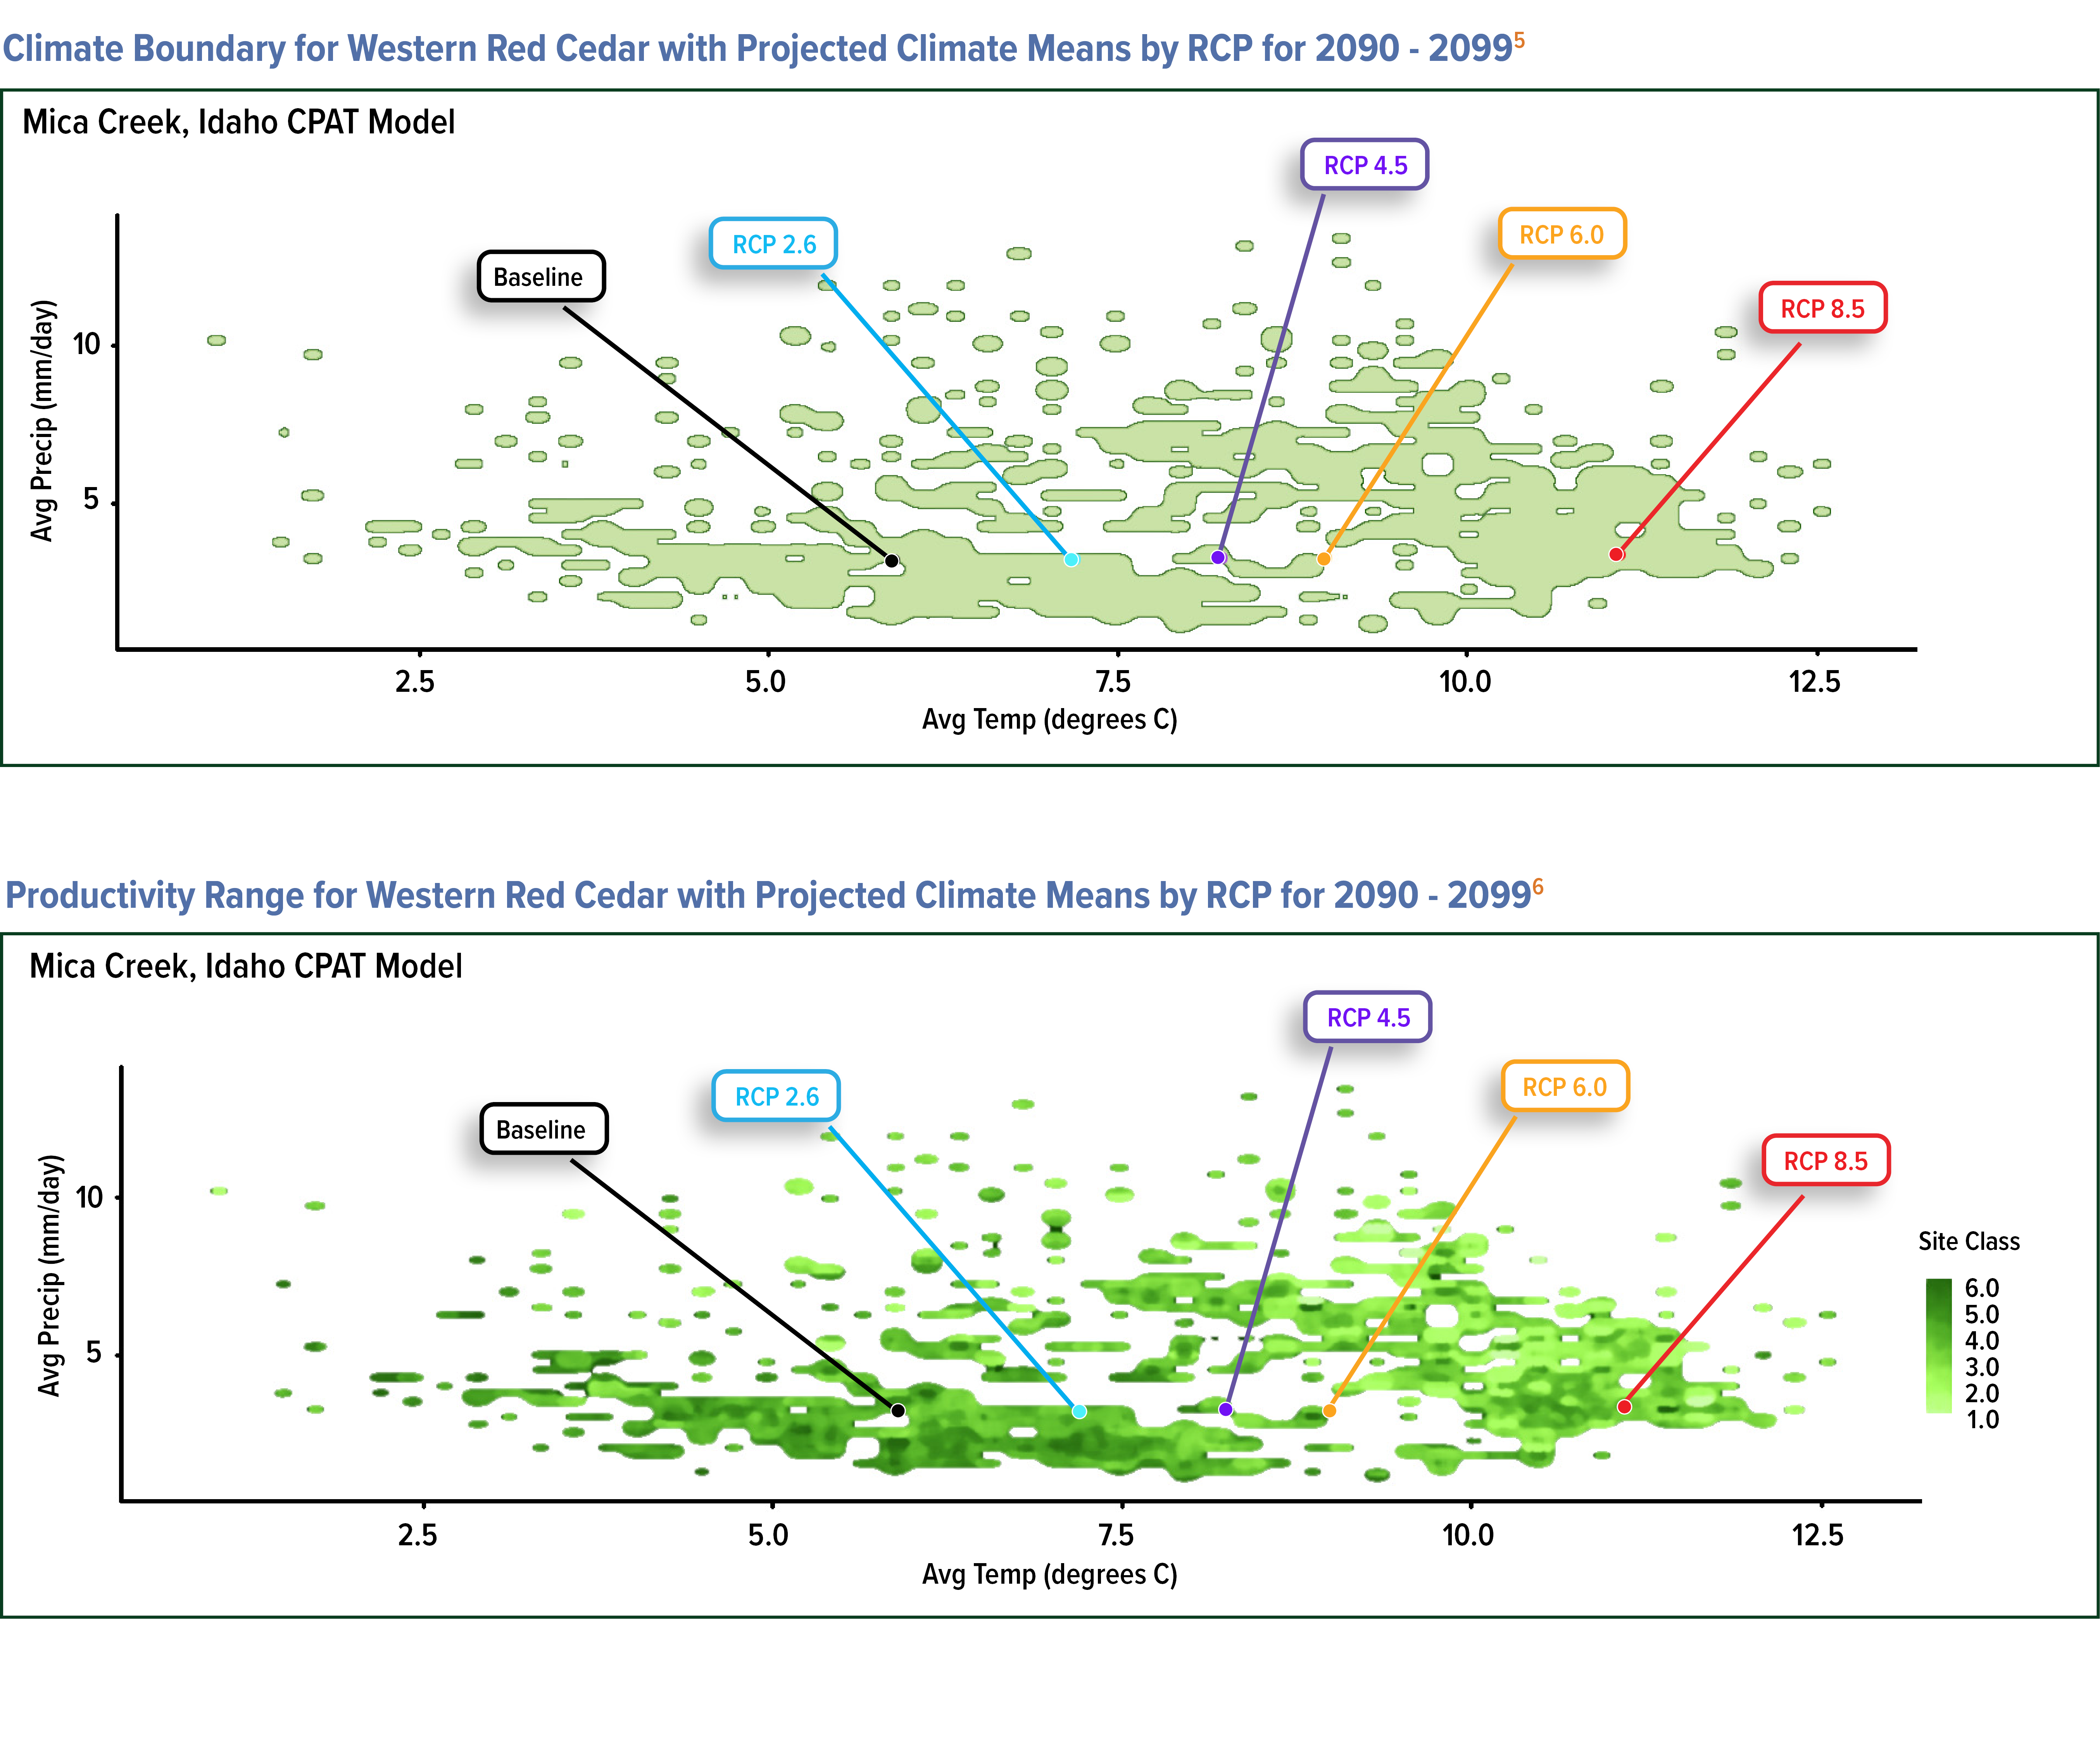
Western red cedar accounts for approximately 12% of our Idaho inventory. This high value species grows best in shady, cool, moist habitats and can be found along streams or in mixed stands on slopes. The species is drought sensitive and prefers moist, acid, well-drained soils. Downscaled RCP 2.6, 4.5 and 6.0 projections for northern Idaho indicate annual climatic conditions are projected to be well suited for growth and productivity through the 2060 decade, which provides a full growing cycle, and through 2100.
The CPAT climate boundary analysis for western red cedar illustrates that the projected range of temperature and precipitation will be suitable for its growth under all RCP scenarios through 2100. The projections for the higher warming scenarios suggest that western red cedar may be less suited to lower elevations with a south or west aspect.
The analysis for western red cedar productivity arising from a combination of temperature and precipitation under various RCP scenarios in 2090-2099 illustrates that RCP 2.6, RCP 4.5, and RCP 6.0 suggest productivity may increase at higher elevations and remain constant over the remainder of the ownership. The highly unlikely RCP 8.5 demonstrates some lower elevation sites may become less productive for western red cedar.
- Idaho Ownership as of June 30, 2022.
- Site index is a term used in forestry to quickly describe the tree growth potential at a particular location or “site”. Trees grown in areas with higher site index have better growth potential.
- The green shaded areas are FIA plot data for climate and productivity where Douglas-fir is currently located.
- The green shaded areas are FIA plot data for climate and productivity where Douglas-fir is currently located.
- The green shaded areas are FIA plot data for climate and productivity where western red cedar is currently located.
- The green shaded areas are FIA plot data for climate and productivity where western red cedar is currently located.
Gulf South Scenario Analysis
PotlatchDeltic owns nearly 1.2 million acres in the Gulf South region. We own nearly 950,000 acres of timberland in Arkansas, 118,000 acres in Mississippi, approximately 87,000 acres in Alabama, and 30,000 acres in Louisiana.1 We mainly grow southern yellow pine with a mix of red oak, white oak, and other hardwoods in bottomlands. Pine seedlings are purchased from third-party nurseries and benefit from generations of selective breeding to promote growth and favorable form characteristics as well as increased resistance to insects and disease.
Temperature projections for our Gulf South region were modeled using CPAT under the four RCPs. Using RCP 2.6, downscaled temperature projections for the region reveal a temperature increase of about 0.3°C from the 2020’s to the 2040’s with no additional increase through the rest of the century. RCP 4.5 shows a temperature increase of approximately 0.6°C from the 2020’s to the 2040’s with an additional increase of roughly 0.8°C expected through the rest of the century. Similarly, RCP 6.0 shows a temperature increase of about 0.5°C from the 2020’s to the 2040’s with an additional increase of approximately 1.8°C through the rest of the century. RCP 8.5 shows a steady increase of roughly 3.9°C between the 2020’s and the end of the century.
Precipitation projections for our Gulf South region do not vary by RCP and none of the pathways project a change in annual precipitation from 2020 to 2100.
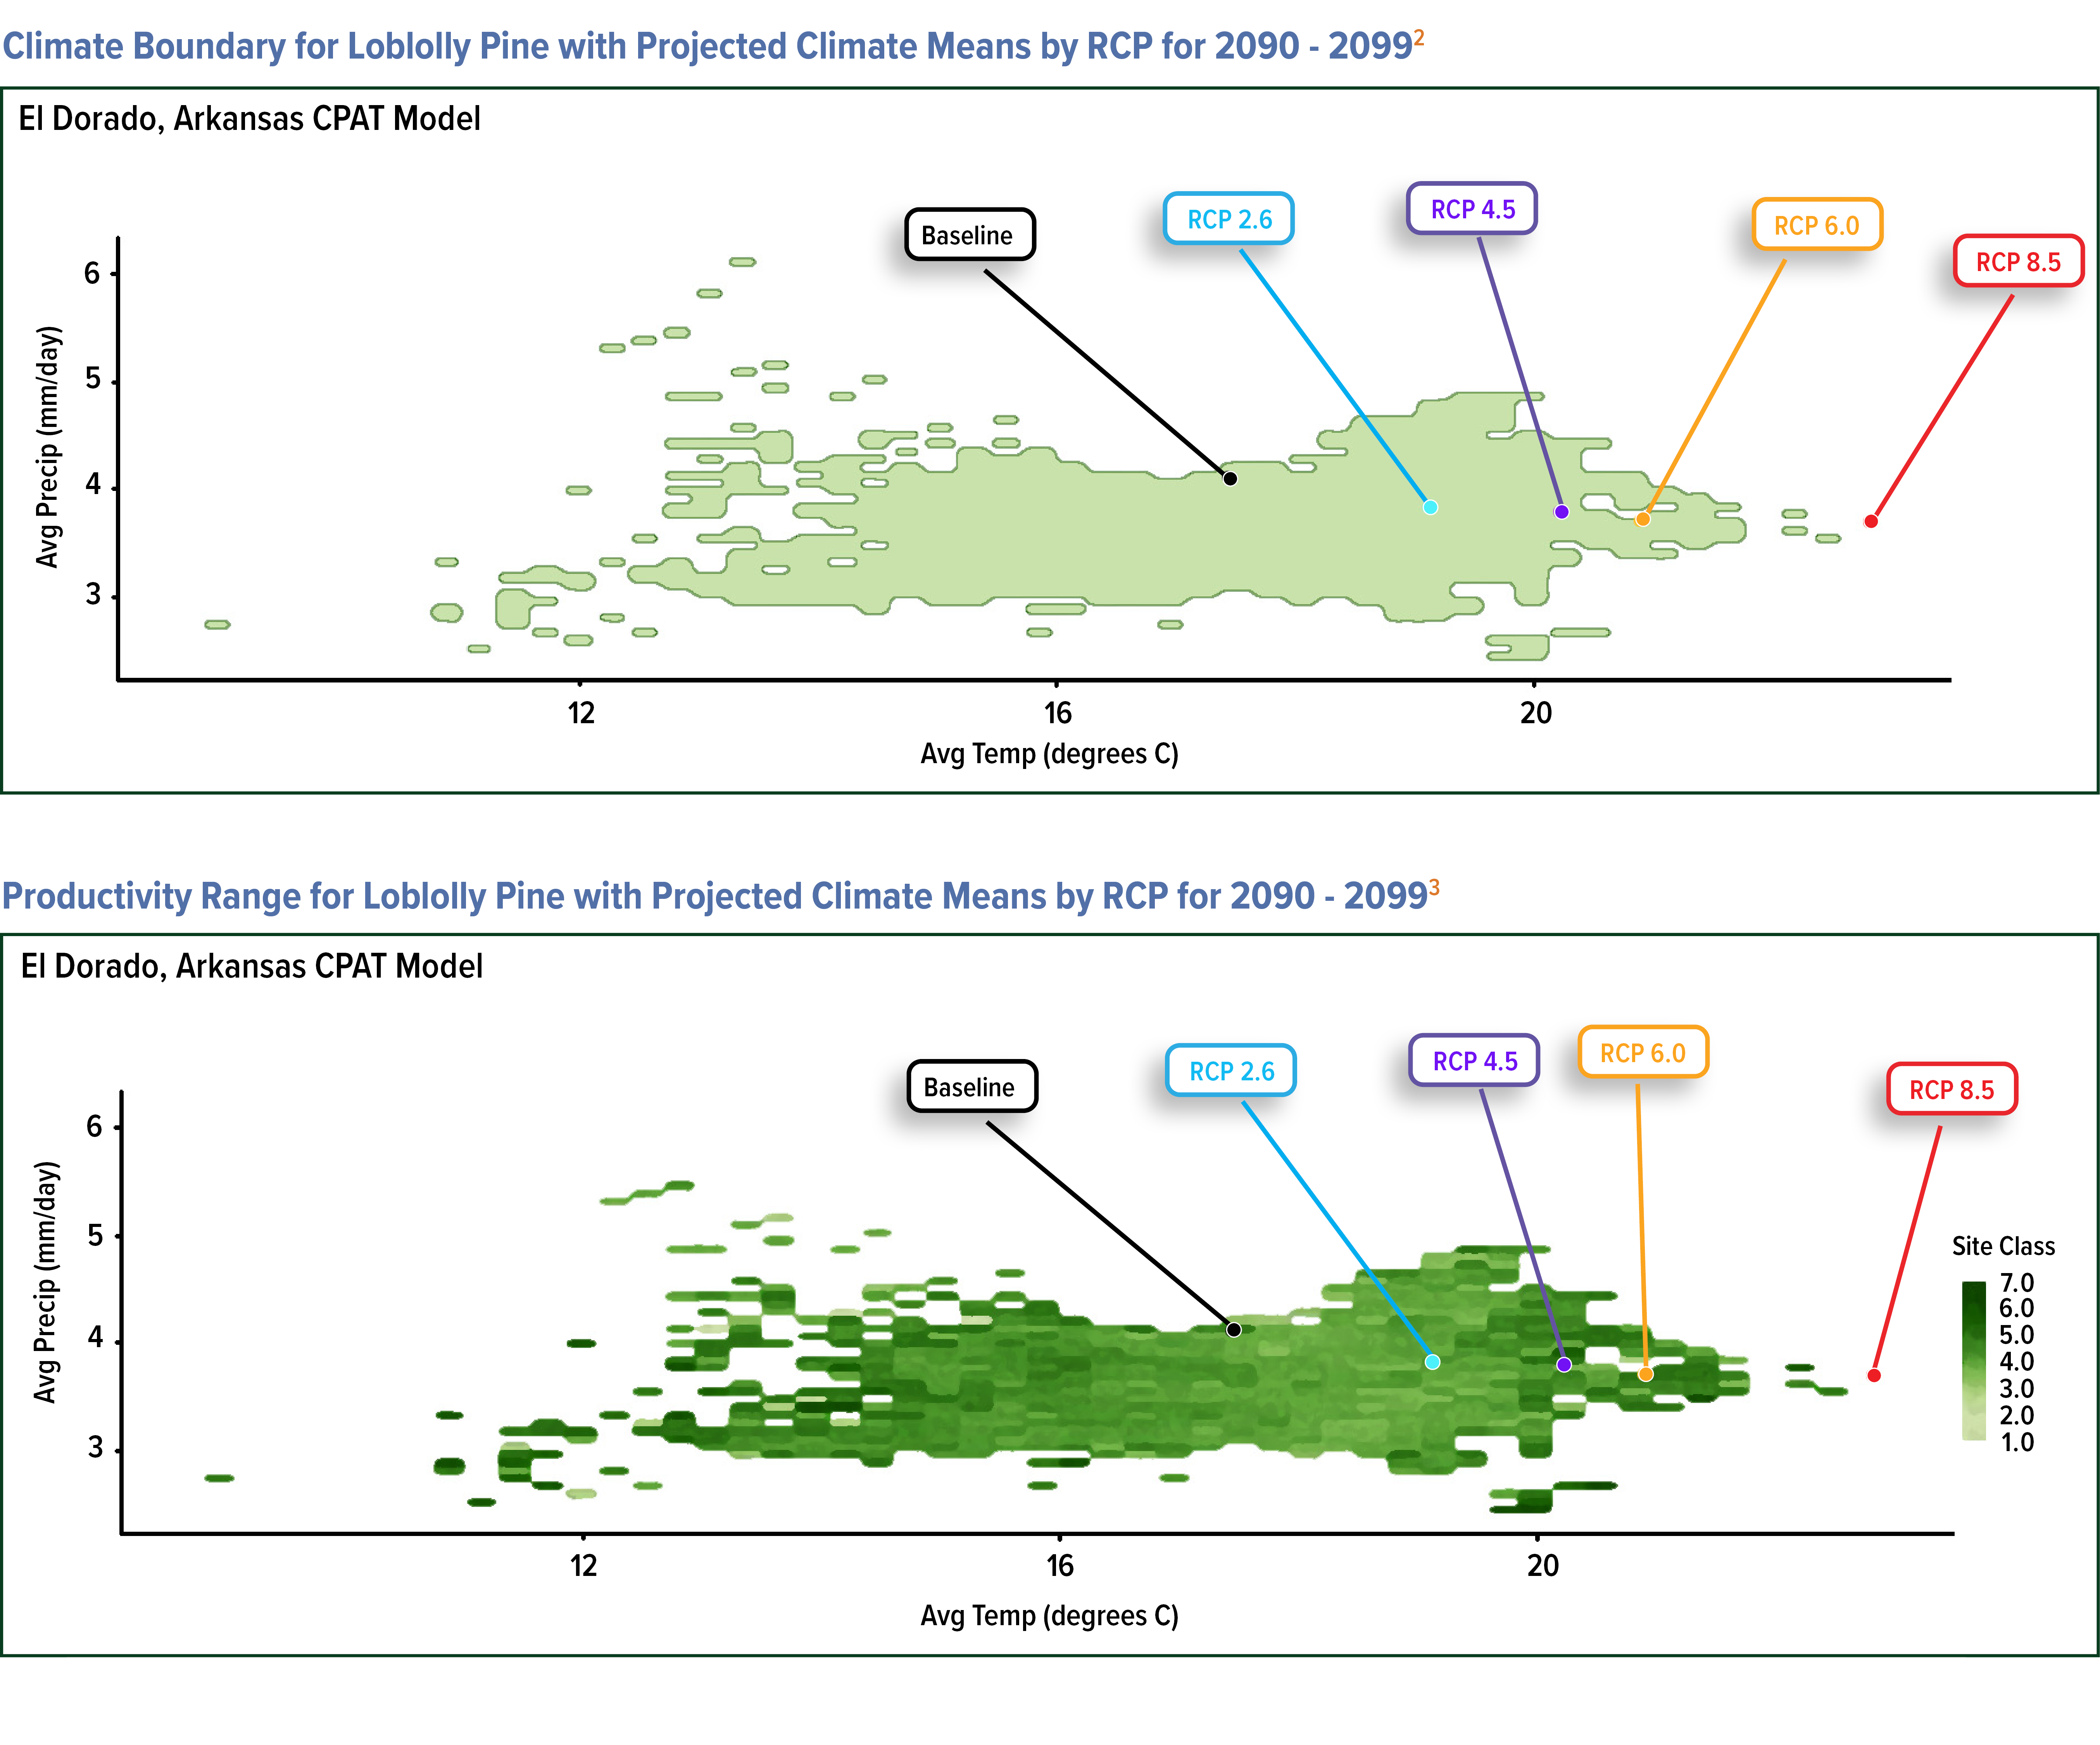
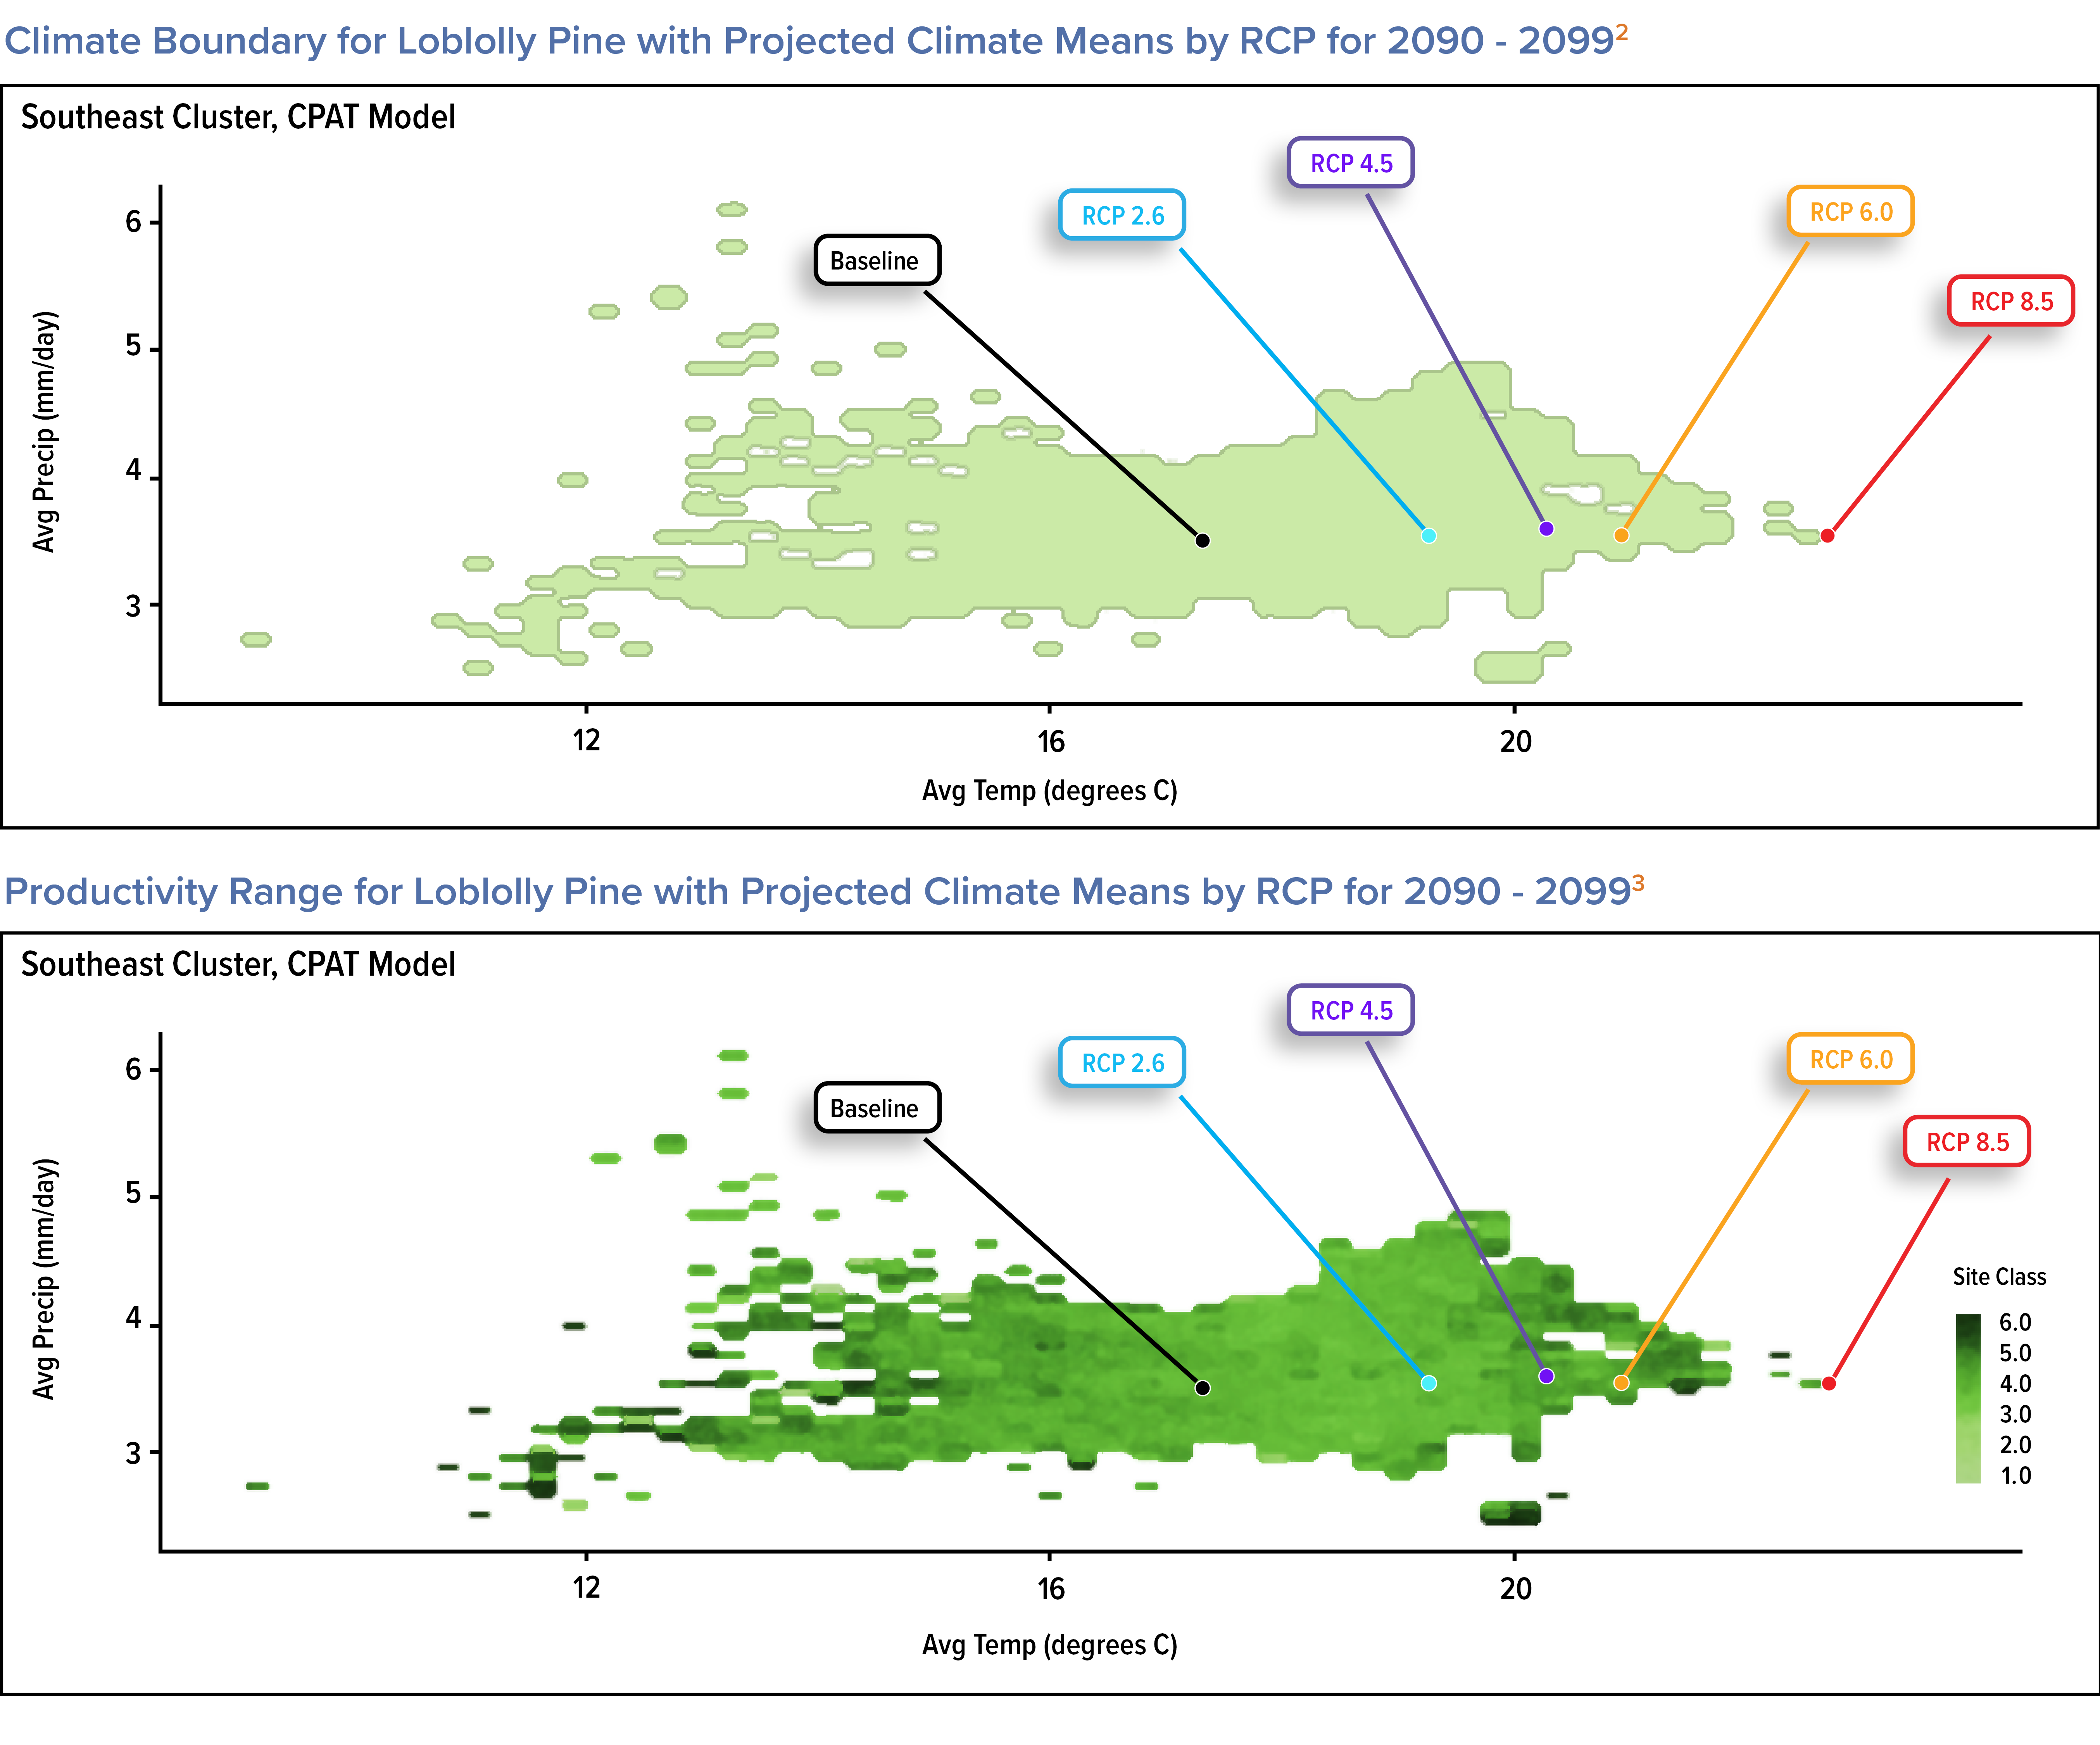
Loblolly Pine Boundary and Productivity Assessment
Loblolly Pine accounts for approximately 70% of our Gulf South forest inventory. The species grows best in full sun or partial shade and prefers acidic soil. It is moderately drought resistant. Downscaled RCP 2.6, 4.5, 6.0, and 8.5 projections for the region indicate annual climatic conditions are projected to be well suited for growth and productivity through the 2040-2049 decade, which provides a full growing cycle.
The CPAT climate boundary analysis for loblolly pine illustrates that the projected range of temperature and precipitation will be suitable for its growth under RCP scenarios 2.6, 4.5, and 6.0 through 2100. The unlikely RCP 8.5 scenario is inconclusive as no loblolly currently exists in those conditions. If there is a greater risk for the species to be out of boundary, we would note this timeframe is three rotations of loblolly pine and breeding for climate-adapted characteristics could likely offset climate impacts.
The analysis for loblolly pine productivity arising from a combination of temperature and precipitation under various RCP scenarios in 2090-2099 illustrates that RCP 2.6, RCP 4.5, and RCP 6.0 suggest no significant change in productivity. The unlikely RCP 8.5 scenario is inconclusive as no loblolly currently exists in those conditions.
- Arkansas, Mississippi, Alabama, and Louisiana ownership as of June 30, 2022.
- The green shaded areas are FIA plot data for climate and productivity where loblolly pine is currently located.
- The green shaded areas are FIA plot data for climate and productivity where loblolly pine is currently located.

Southeast Scenario Analysis
PotlatchDeltic owns approximately 278,000 acres of timberland in the Southeast.1 This includes approximately 215,000 acres in Georgia and approximately 63,000 acres in South Carolina. Over 86% of our upland stands in the area are dominated by loblolly pine with other conifer species such as slash and long-leaf pine also present. Riparian acreage is dominated by hardwoods such as oaks, yellow poplar, or sweetgum. Of the Southern forest holdings, our tracts located in Coastal Georgia boast the highest site productivity of the region.
Third-party nurseries grow our Georgia and South Carolina seedlings. We benefit from generations of selected breeding to promote growth, improve form and increase resistance to insects and disease.
To evaluate climate impacts, we used a central point located within Georgia and South Carolina. Temperature projections were modeled using CPAT under the four RCPs. Using RCP 2.6 downscaled temperature projections reveal a temperature increase of about 0.43°C from the 2020s to the 2040s with 0.01°C additional increase through the rest of the century. RCP 4.5 shows a temperature increase of approximately 0.74°C from the 2020s to the 2040s with an additional increase of about 0.81°C expected through the rest of the century. Similarly, RCP 6.0 shows a temperature increase of about 0.55°C from the 2020s to the 2040s with an additional increase of approximately 1.8°C through the rest of the century. RCP 8.5 shows a steady increase of roughly 4.1°C between the 2020s and the end of the century.
Precipitation projections for the Southeast do not vary meaningfully by RCP and all four pathways project a gradual increase of 1-2% from 2020 to 2100. Coastal area increases are expected to be slightly higher, averaging between 6-7% for all RCP.
Loblolly Pine Climate Boundary and Productivity Assessment
Loblolly pine accounts for approximately 86% of our Southeast forest inventory. The species grows best in full sun and prefers acidic soil. It is moderately drought resistant. Downscaled RCP 2.6, 4.5, 6.0, and 8.5 projections for the region indicate annual climatic conditions are projected to be well suited for growth and productivity through 2100.
The CPAT climate boundary analysis for loblolly pine forecasts that the projected range of temperature and precipitation will be suitable for its growth under all RCP scenarios through 2100. Its climate requirements include humid and hot summers along with a mild winter. Seasonal fluctuations in weather patterns that include the projected warmer winters, modest precipitation increases, and hot, humid summers may prove favorable for many decades under all RCP.
The analysis for loblolly pine productivity arising from a combination of temperature and precipitation suggests that the species will remain within its historic range for all RCP through 2100. There is little to no change in projected site productivity in this part of the species’ range.
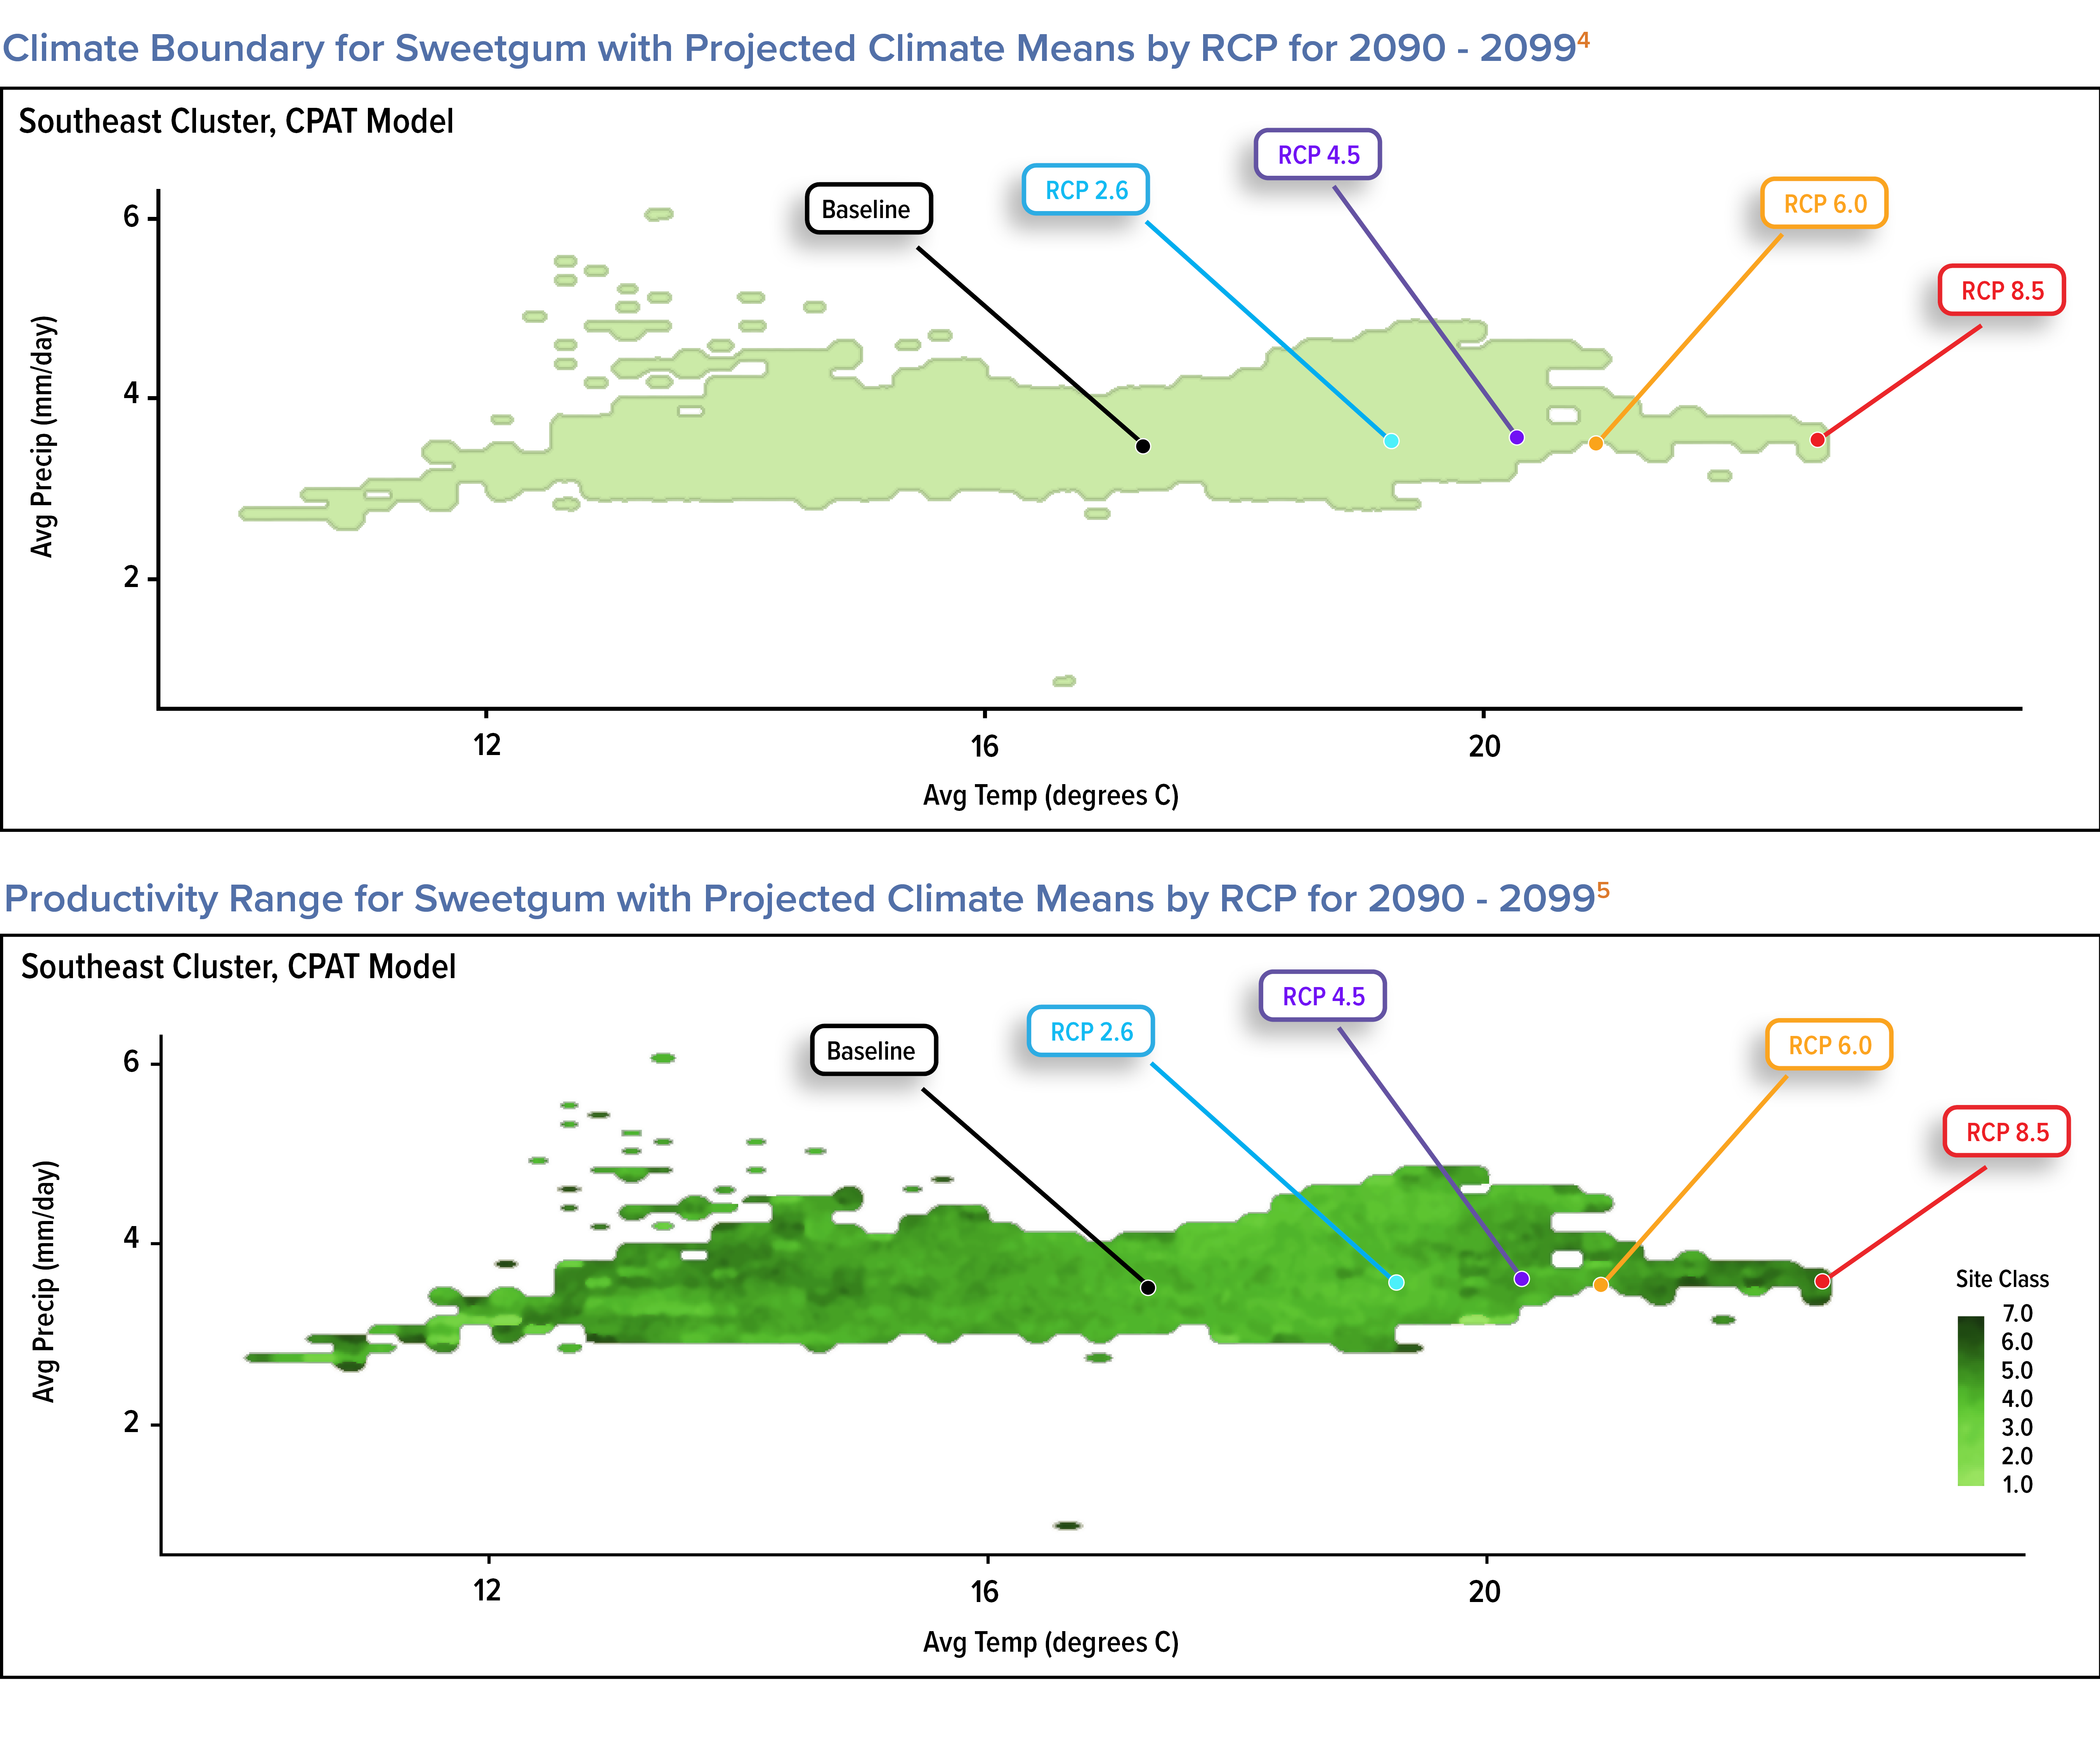
Sweetgum Climate Boundaryand Productivity Assessment
Sweetgum accounts for approximately 5% of our Georgia and South Carolina inventory. It is common in riparian hardwood stands, often comprising 20% of the inventory. Known for its exceptional adaptability, this species demonstrates commercial growth potential in upland soils and thrives along streams and river bottoms. Projections for sweetgum in the southeast indicate climatic conditions are projected to be well suited for growth and productivity through 2100 for all RCP.
The CPAT climate boundary analysis for sweetgum illustrates that the projected range of temperature and precipitation will be suitable for its growth under all RCP scenarios through 2100. sweetgum’s adaptability may allow colonization of higher elevation areas while maintaining a fair degree of drought tolerance. This species is found from Texas to Central Florida, to New Jersey, across all the southern portion of the Midwest demonstrating its ability to adapt and thrive in different climatic conditions. Genetic variation of sweetgum across the U.S. allows considerable management flexibility for this important riparian species.
- Georgia and South Carolina timberland acreage as of June 30, 2023.
- The green shaded areas are FIA plot data for climate and productivity where loblolly pine is currently located.
- The green shaded areas are FIA plot data for climate and productivity where loblolly pine is currently located.
- The green shaded areas are FIA plot data for climate and productivity where sweetgum is currently located.
- The green shaded areas are FIA plot data for climate and productivity where sweetgum is currently located.
Lake States Scenario Analysis
PotlatchDeltic owns two sawmills in the Lake States. The sawmills produce precision-cut studs from spruce, pine, and fir (SPF). The Gwinn, Michigan sawmill has 185 MMBF annual capacity and the Bemidji, Minnesota sawmill has 140 MMBF annual capacity.1 We do not own timberlands in the Lake States and both sawmills procure all their logs from external sources. We procure a variety of conifer species including white spruce, red pine, jack pine, Norway spruce, balsam fir, and black spruce. Red pine accounts for approximately 75% of the log volume at Bemidji and Gwinn.
To evaluate climate impacts, we used a central geographic point located between the two sawmills. Care was taken to ensure the point represented the forecast climate at both locations.
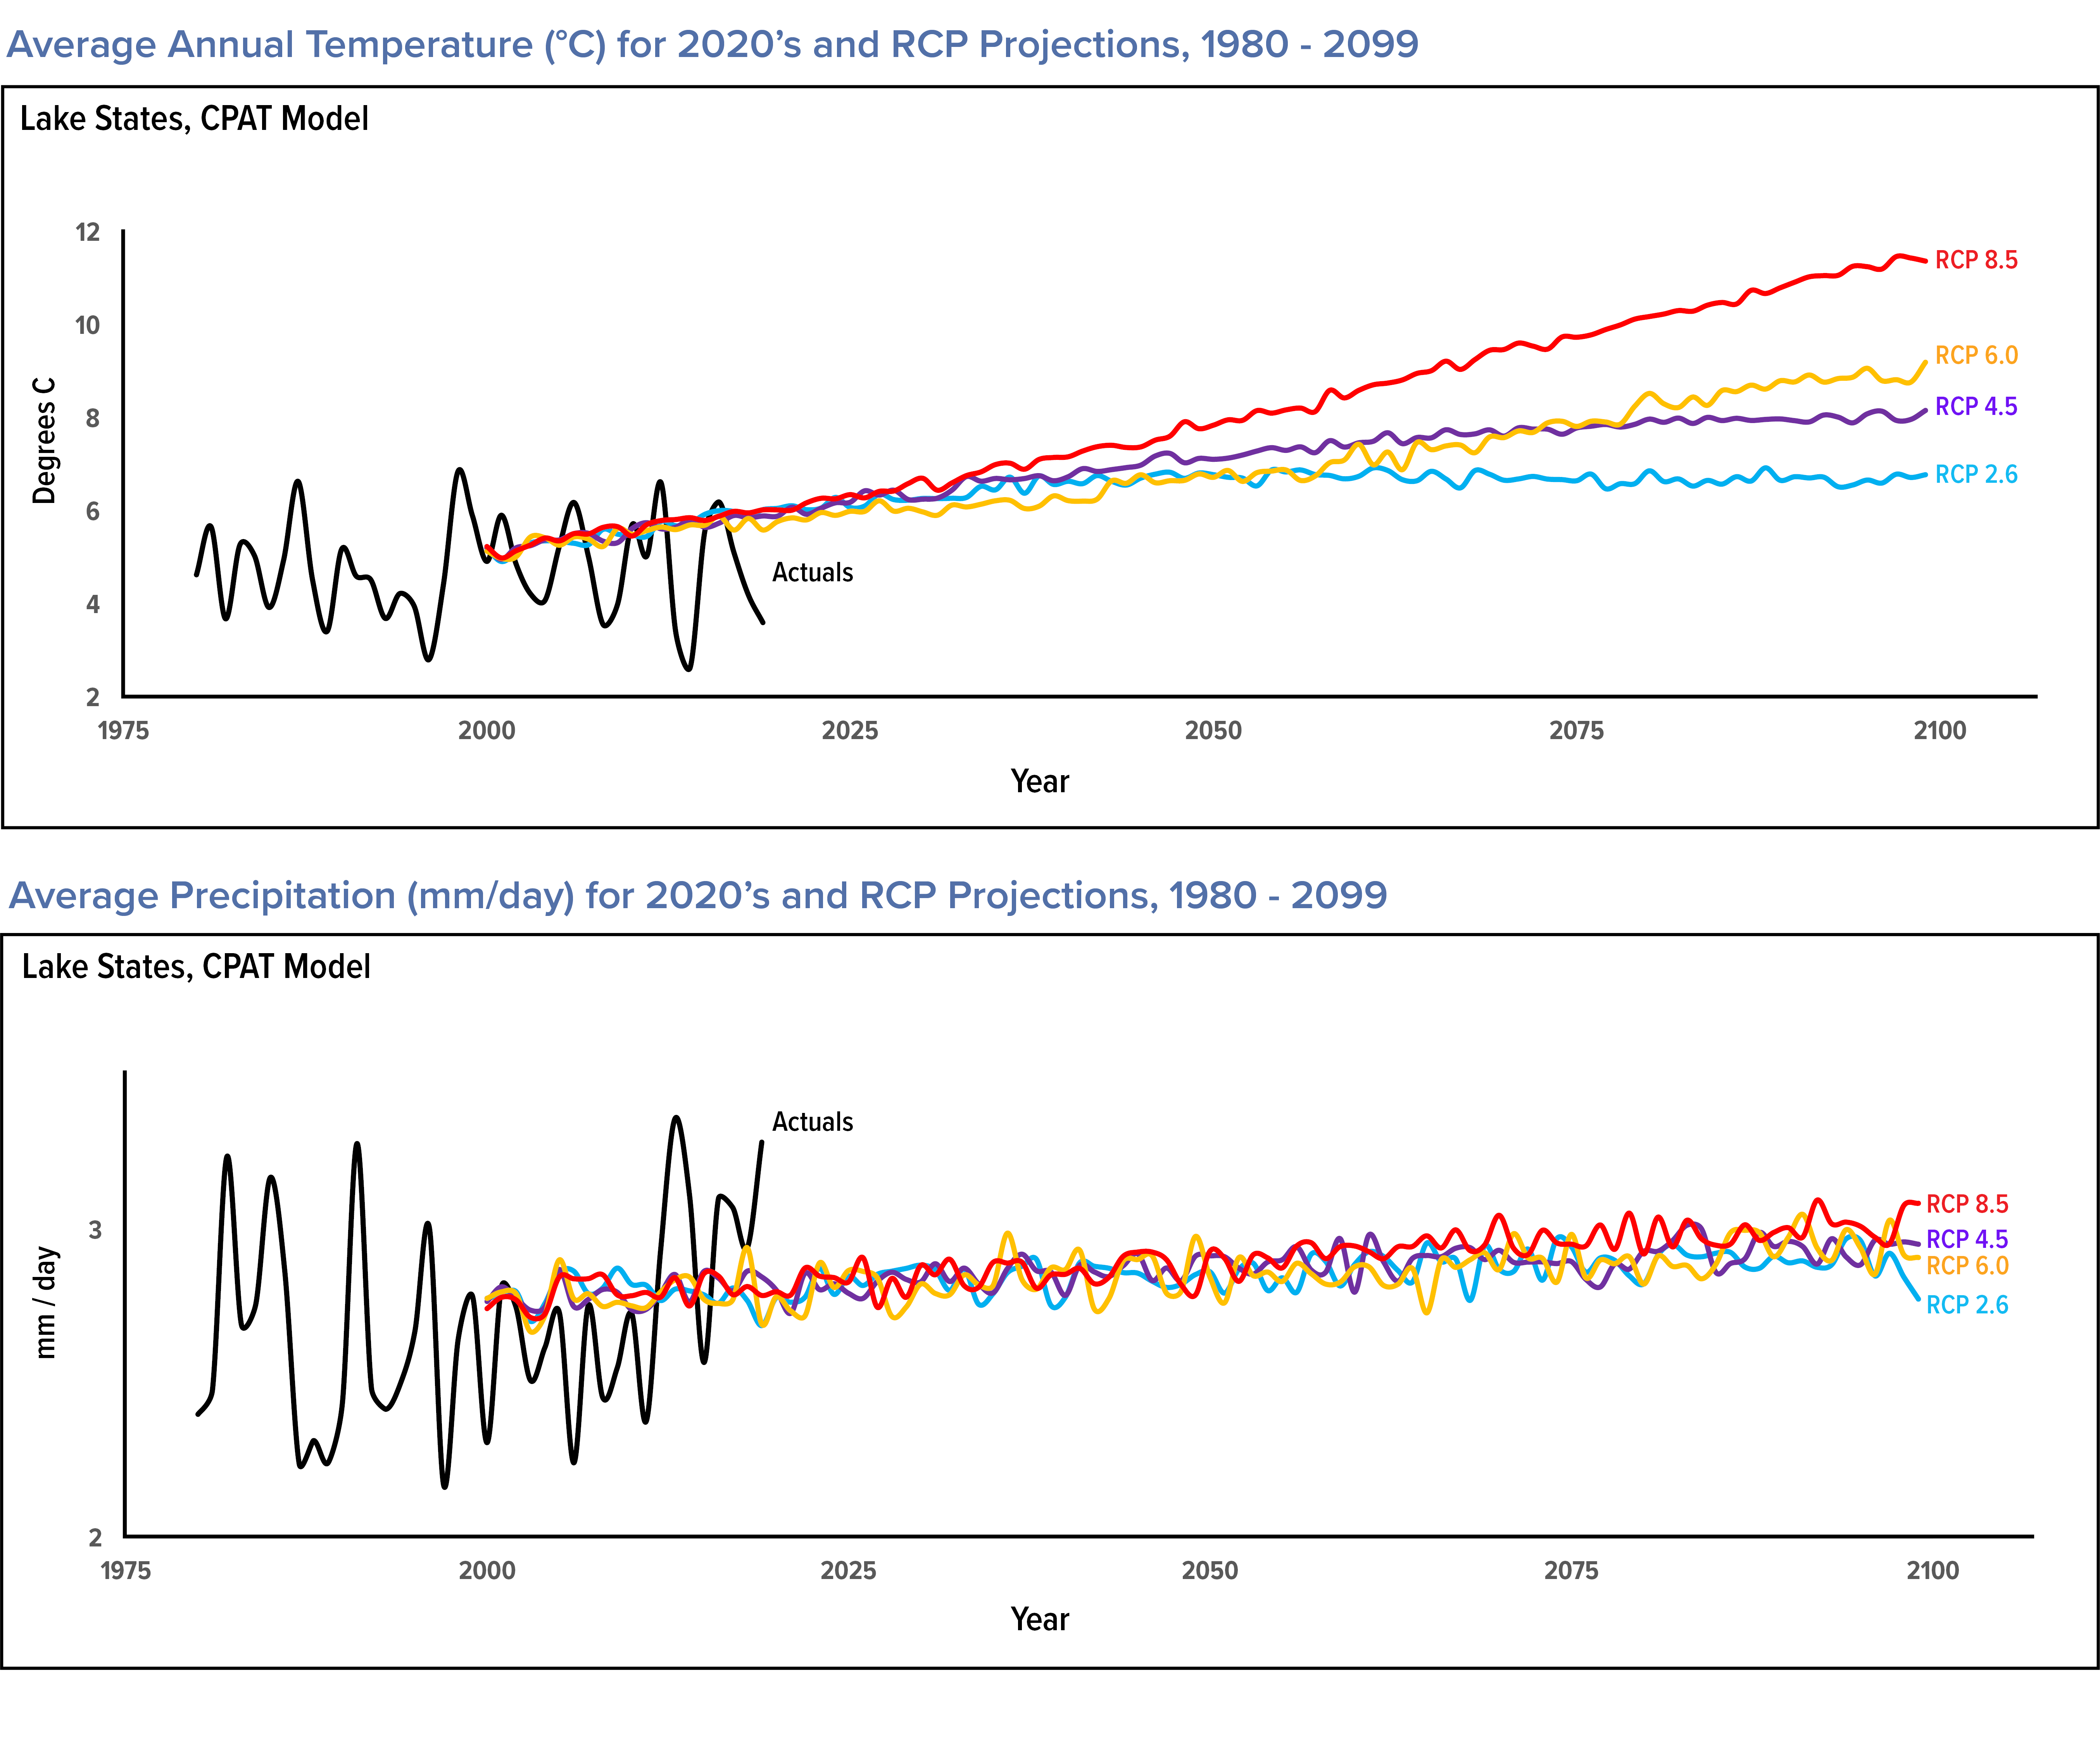
Temperature projections for our Lake States region were modeled using CPAT under the four RCPs. RCP 2.6, downscaled temperature projections for the region reveal a temperature increase of about 0.6°C from the 2020s to the 2040s with an increase of 0.14°C from 2040 through 2100. RCP 4.5 shows a temperature increase of approximately 0.85°C from the 2020s to the 2040s with an additional increase of roughly 1.4°C expected through the rest of the century. RCP 6.0 shows a temperature increase of 0.45°C from the 2020s to the 2040s with an additional increase of approximately 2.9°C through the rest of the century. RCP 8.5 shows a steady increase of approximately 5.4°C between the 2020s and the end of the century.
Precipitation projections for our Lake States region do not vary by RCP through 2040. Projections are for a precipitation increase of 0-2% from the 2020s through 2040 and a 1-7% increase from 2040 through the end of the century.
Red Pine Boundary and Productivity Assessment
Red pine, also known as Norway pine in the region, is the most important species for logs sourced into our Lake States region mills. Red pine are fairly drought tolerant and prefer acidic sandy soil conditions. Downscaled climate projections in the Lake States for RCP 2.6, 4.5, and 6.0 indicate favorable growing conditions, especially in the eastern portion of the region closer to Gwinn.
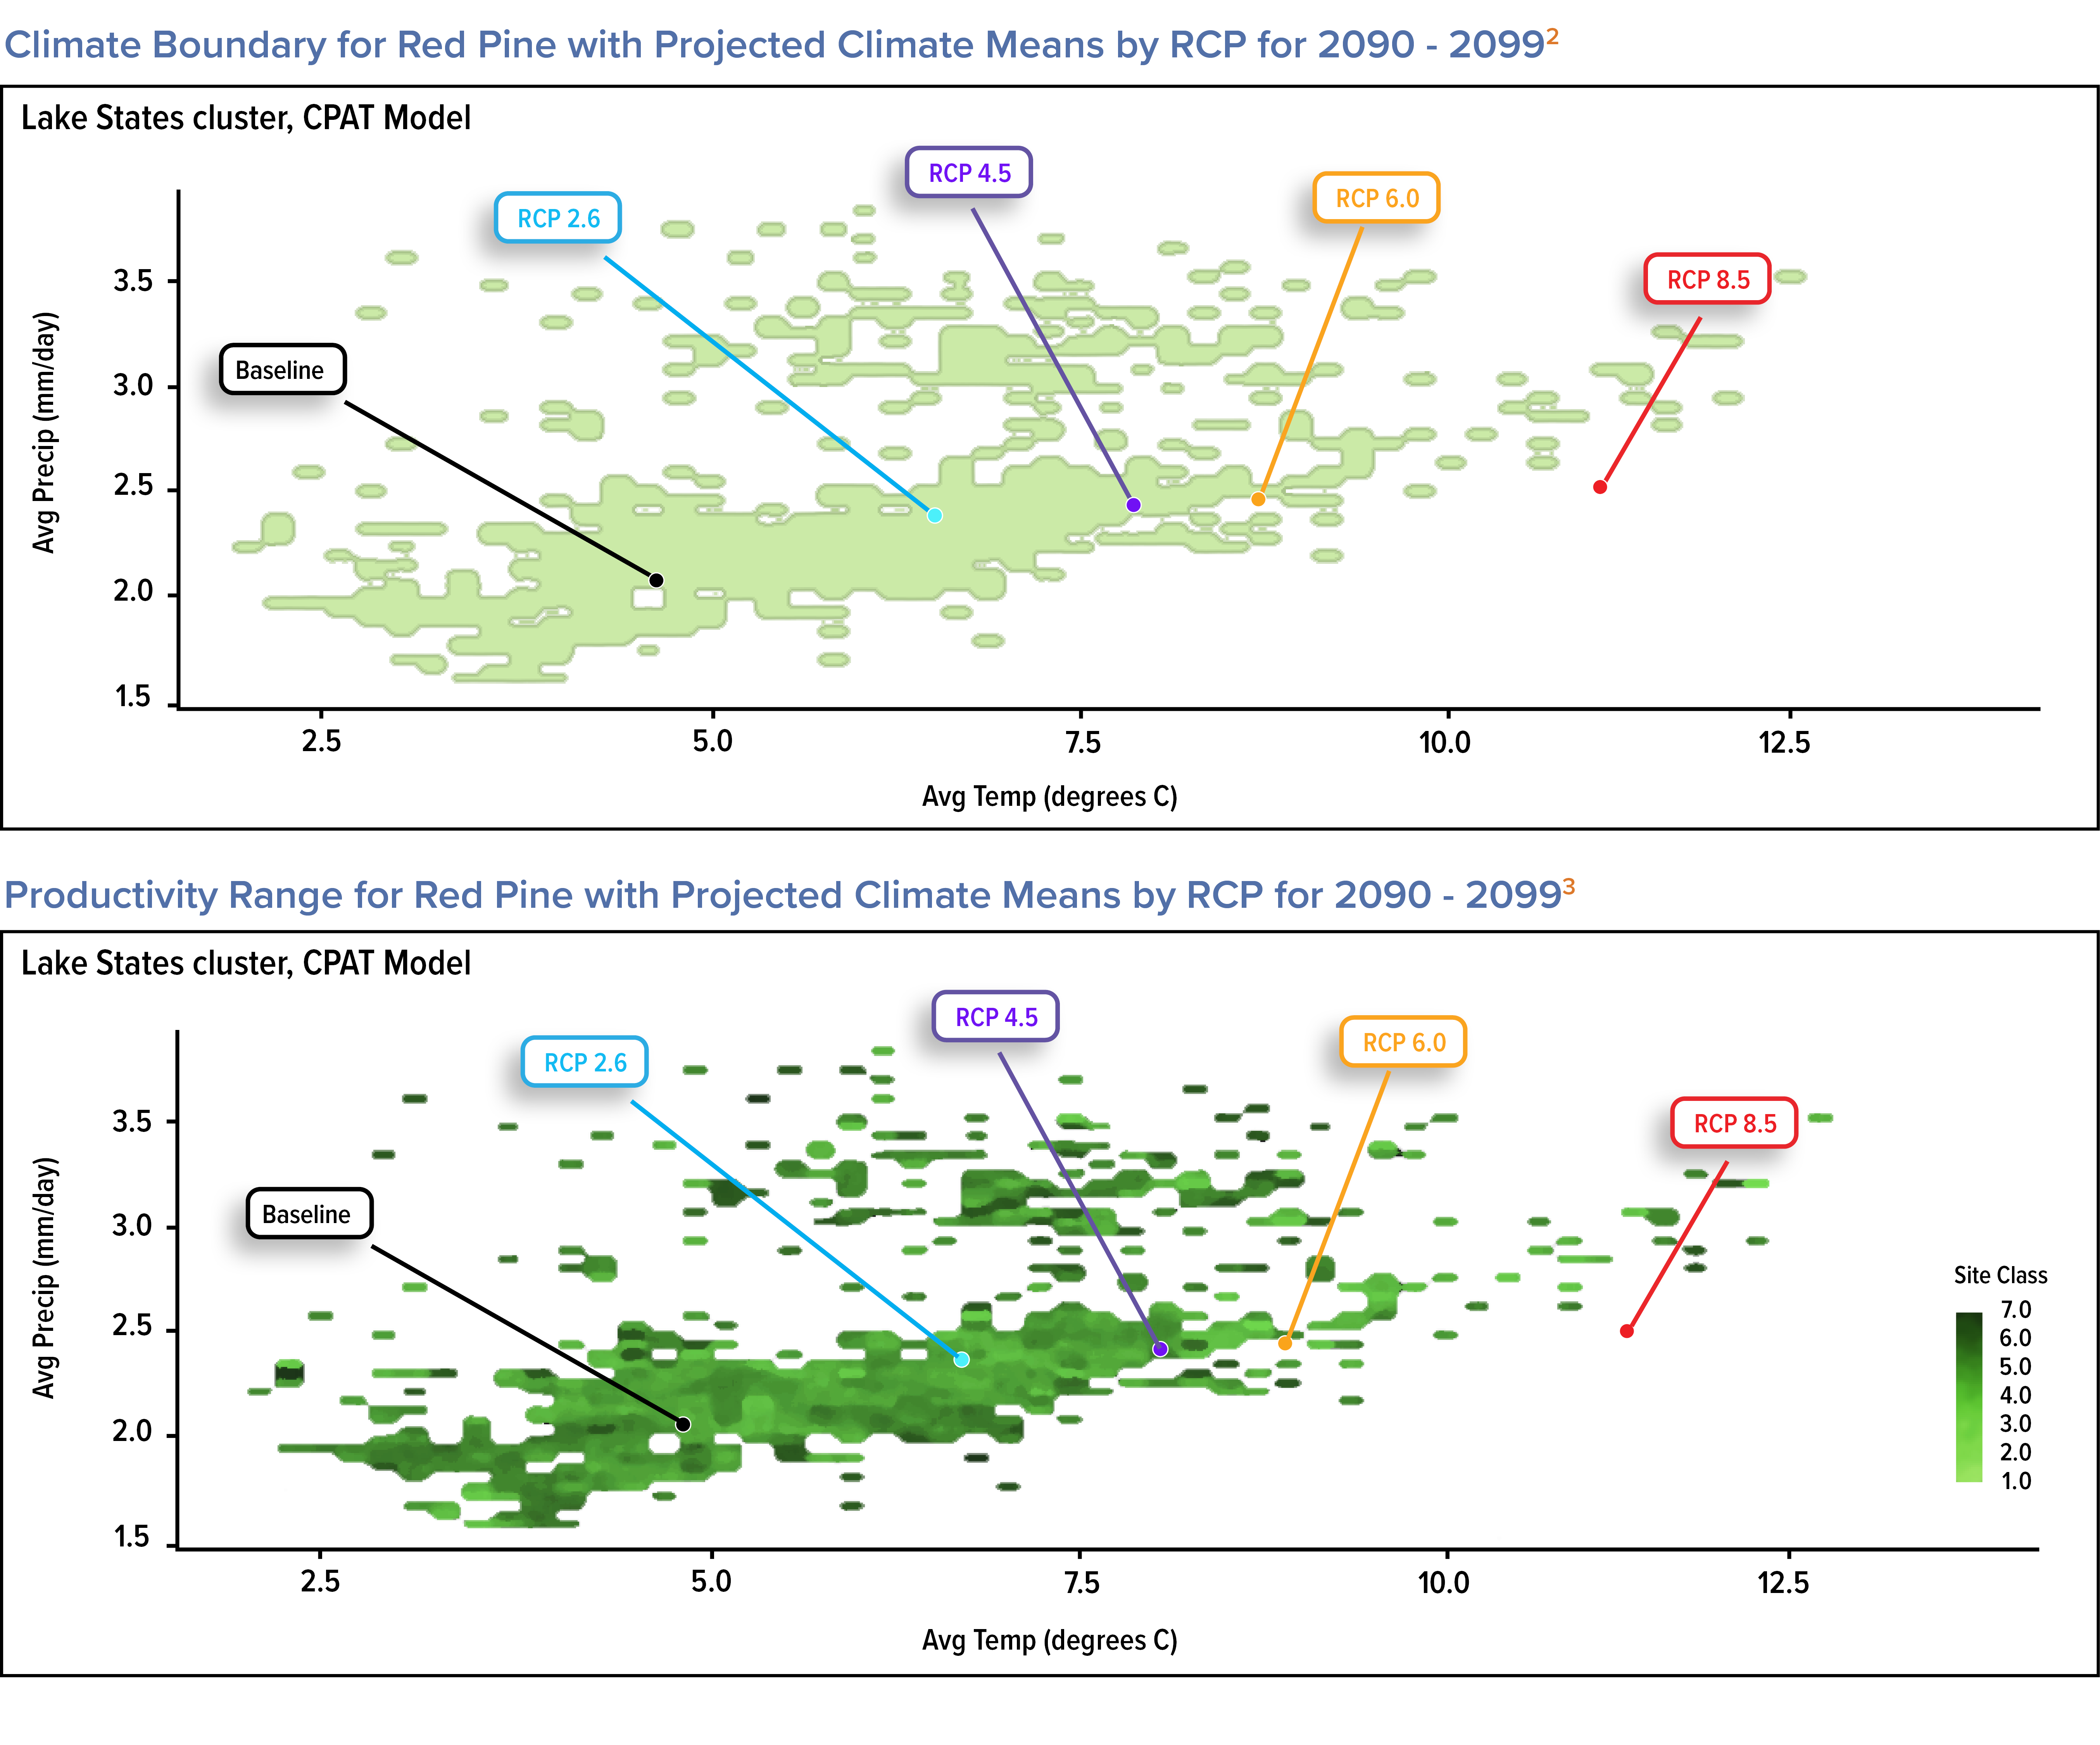
The CPAT climate boundary analysis for red pine illustrates that the projected range of temperature and precipitation will be well-suited for its growth under RCP scenarios 2.6, 4.5, and 6.0 through 2100. Precipitation amounts are lower in the western portion of the Bemidji log sourcing area and when coupled with the rising temperature projected under RCP 8.5 red pine’s productivity could decrease and conditions for its growth and survival may become unsuitable.
The analysis for red pine productivity arising from a combination of temperature and precipitation under RCP scenarios 2.6, 4.5, and 6.0 in 2090- 2099 project favorable productivity for red pine. Conditions in the eastern portion of the region closer to Gwinn are most favorable. RCP 8.5 places red pine at the periphery of its range beginning in 2060 and warmer conditions without increases in precipitation may cause decreases in productivity and eventually eliminate its ability to survive. The presence of the Great Lakes are confounding factors in downscaled climate projections. As climate projection models improve our ability to assess productivity and suitability for survival will increase.
- Sawmill capacity as of December 31, 2022. Capacity represents the proven annual production capabilities of the facility under normal operating conditions and producing a normal product mix. Excludes overtime.
- The green shaded areas are FIA plot data for climate and productivity where red pine is currently located.
- The green shaded areas are FIA plot data for climate and productivity where red pine is currently located.
Genetic Enrichment Tree Species
In forest management, we often talk of genetically enriching a tree species, but what does that really mean? One thing it does NOT mean is that we plant genetically modified organisms (GMO). GMOs are created through splicing, separating, and adding distinct genetic material to a model organism using various molecular biology techniques. As a member of the Sustainable Forestry Initiative® (SFI®), PotlatchDeltic is committed to maintaining natural planting stocks and not introducing GMO saplings to our forests.
A genetically enriched organism has a change in appearance or characteristic (phenotype) through a natural process known as Mendelian inheritance. While more complex than stated, this process has a donor parent, which is selected for desirable traits by trained silviculturists, impart genetic material to a mother tree to produce a new generation of plants. Through time and careful selection silviculturists can extract the best traits a family of trees has to offer.
In controlled mass pollination the female strobili, where pollen enters, are covered with a bag during a short window in which they are capable of breeding. This prevents random undesirable pollen from pollinating the trees.
The genetically superior pollen of desirable trees is inoculated into the bags, which are removed shortly after, allowing the strobili to grow into cones.
The cones produce seeds which are grown into the next generation of trees on our timberlands. This process is manually intensive and takes decades to create seed orchards; however, the payoff of improved trees is well worth it.
PotlatchDeltic has been involved with tree enrichment and improvement programs for the last sixty years. We operate seed farms in our Idaho timberlands but also collaborate with other companies, universities, and consortiums to develop the latest tree genetics in other regions.
Fusiform rust, an endemic fungal pathogen of the Southeastern US, has been a blight on the forestry sector throughout the history of American forestry. A successful collaboration between the public and private sector has led to the creation of disease-resistant planting stocks alleviating issues relating to stand establishment.

Timberland Productivity Impacts
Higher atmospheric CO2 concentration and atmospheric nitrogen deposition can lead to multiple effects from CO2 enrichment resulting in productivity gains for timberlands. In response to elevated CO2, trees use water more efficiently, which increases growth efficiency and reduces water loss.
The likelihood of increased productivity on managed loblolly pine over the coming decades could lead to increased carbon storage and changes in silvicultural practices including shorter rotations. It is important to note that the growth response appears to vary under different ambient CO2 concentrations.
One study evaluated the impact of changing climate (RCP 8.5 and RCP 4.5) and of higher ambient CO2 levels of loblolly pine growth with results suggesting that ambient CO2 enrichment would likely be a more important driver of increased productivity than climate impacts.1 The productivity response noted in the study using growth and yield modeling demonstrated a median-level productivity benefit for CO2 alone in 2040-2059 of 19.7% (+-8.3%) for RCP 8.5 and 13.2% (+- 6.5%) for RCP 4.5. A second study revealed average productivity gains for loblolly pine of +-30% by 2055 under an RCP 8.5 scenario.2 The studies did not include potential changes from fire, insects, or pests which could have either a positive or negative effect. Positive effects can result from increased ability of vigorously growing trees to defend against insect attacks or from higher CO2 inhibiting pests or pathogens.
- Harold E Burkhart et al., “Regional Simulations of Loblolly Pine Productivity with CO2 Enrichment and Changing Climate Scenarios,” Forest Science 64, no. 4 (April 18, 2018): https://doi.org/10.1093/forsci/fxy008
- R. Quinn Thomas et al., “A Mid-Century Ecological Forecast with Partitioned Uncertainty Predicts Increases in Loblolly Pine Forest Productivity,” Ecological Applications 28, no. 6 (July 12, 2018): https://doi.org/10.1002/eap.1761